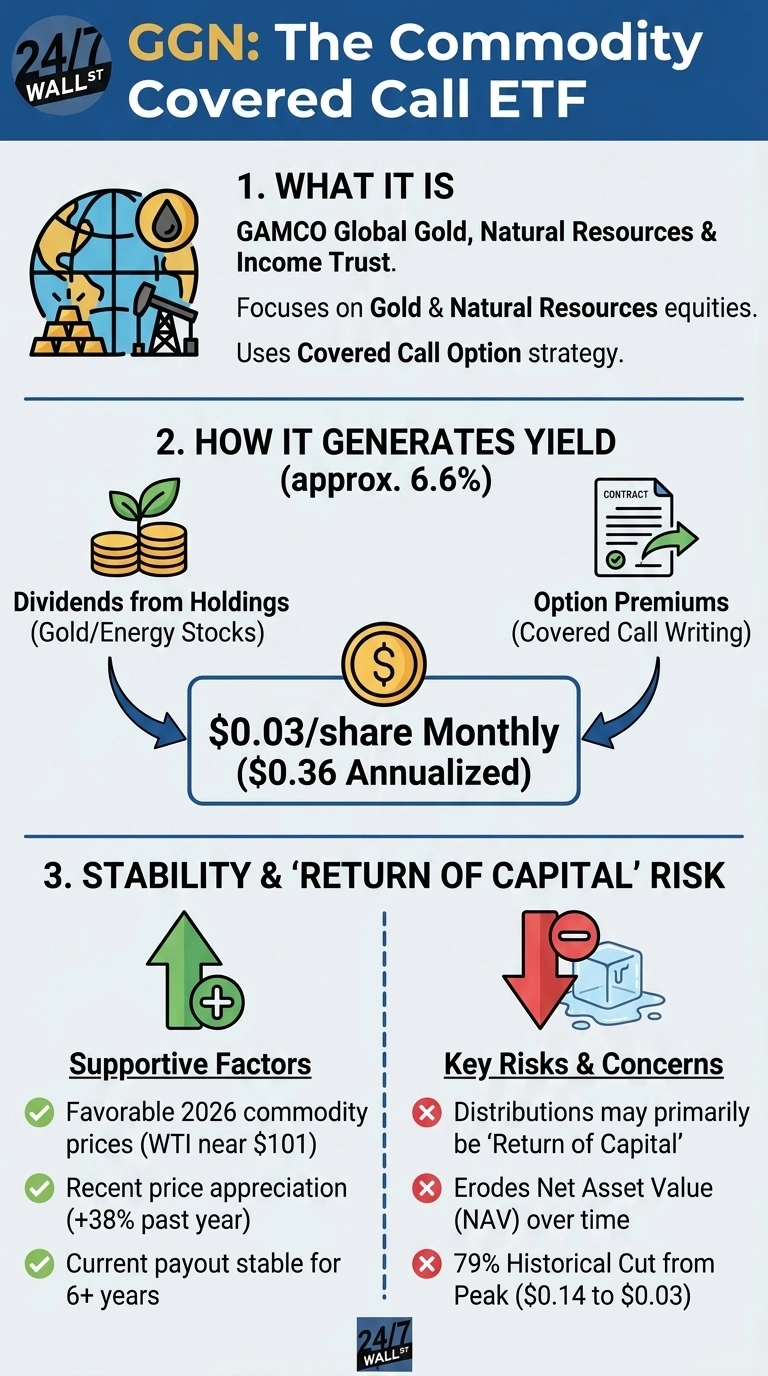
GAMCO Global Gold, Natural Resources & Income Trust (NYSE:GGN) pays $0.03 per share monthly, which annualizes to $0.36 per share, yielding roughly 6.6% at current prices. With WTI crude near $101 per barrel and gold up roughly 48% over the past year, the 2026 commodity environment is favorable. That tailwind runs counter to a structural feature that gradually erodes investor capital.
Where the Monthly Payment Comes From
GGN generates income through two channels. The fund holds a concentrated portfolio of gold-mining and energy companies, with roughly 55% in precious metals and 32% in energy, collecting dividends from those positions. The fund also writes covered call options against its equity holdings. By agreeing to sell stocks at a fixed strike price, GGN collects upfront option premiums. Those premiums, combined with stock dividends, fund the monthly distribution.
The covered call overlay has a built-in cost: if the underlying stocks rise above the strike price, GGN sells at the capped level and misses out on additional upside. In a strong commodity rally, the fund participates in part of the gains but surrenders the rest. The premium income is real, but it comes at the expense of full participation in the commodity cycle.
The Return of Capital Disclosure
GGN’s board issued a critical disclosure in its February 11, 2026 distribution announcement: “These distributions may exceed the Fund’s distributable earnings” and are expected to primarily constitute a return of capital for tax purposes in 2026. The board also stated that “current distributions do not reflect overall investment performance.”
Return of capital means a portion of each monthly payment is the fund returning investors’ own money rather than distributing earned income. This gradually lowers the fund’s net asset value unless price appreciation offsets the erosion. In a flat or declining commodity market, the NAV shrinks while distributions continue, creating the “melting ice cube” dynamic where the yield percentage stays elevated precisely because the asset base is shrinking.
Distribution History and Commodity Cycles
GGN’s payout history illustrates how tightly distributions track commodity conditions. The fund paid $0.14 per month at its peak from 2008 to 2011, then steadily reduced payments as commodity cycles turned. By 2015 through 2019, the monthly payment had fallen to $0.07. A further reduction brought it to $0.05 in early 2020, followed by a cut to the current $0.03 in June 2020. From peak to present, that represents a 79% reduction in the monthly distribution.
The $0.03 monthly rate has held unchanged for over six years through varying commodity conditions. The long trajectory shows the board does reduce payouts when underlying income compresses, and the current $0.03 reflects a normalized level following years of downsizing, not a floor with structural protection.
The 2026 Commodity Environment
The current environment works in GGN’s favor. WTI crude reached a 12-month high of $119.48 before pulling back to around $101. Natural gas spiked to $7.72 per MMBtu in January 2026 before settling near $3 by March. Higher commodity prices produce more volatile underlying stocks, which generate richer option premiums when GGN writes calls. That directly supports the fund’s ability to sustain the $0.03 monthly payment.
Total return has been strong. GGN shares have risen roughly 38% over the past year and about 137% over five years. Over a five-year period, GGN delivered 131% in total returns versus 70% for the S&P 500. Price appreciation of that magnitude offsets NAV erosion from return-of-capital distributions. The risk is that the dynamic reverses if commodity prices retreat.
Yield Sustainability Depends on Commodity Prices Holding
The $0.03 monthly distribution appears stable in the near term. The commodity environment is supportive, option premiums are elevated, and the payout has held for over six years. The structural caveat is real and disclosed by the fund itself: distributions are primarily return of capital, not earned income, and the board has cut payouts by 79% from peak when conditions deteriorated. The yield is sustainable as long as commodity prices remain elevated and volatility supports premium income. The fund’s own disclosures describe the distributions as primarily return of capital rather than earned income, and the board has demonstrated willingness to cut payouts when commodity conditions deteriorate.