Growth investors walked into 2026 expecting more of the same with tech momentum, AI tailwinds, and another year of the Nasdaq leading the way. Instead, value has quietly taken the wheel, and with the broad, large-value category only up around 1.54% from early April, the three funds covered here aren’t just beating the benchmark. In fact, there are two that are nearly quintupling it, and one is lapping the whole field.
This shift matters because it isn’t coming from a single corner of the value universe, as two Vanguard funds and one iShares fund are all outperforming using different methodologies, sector tilts, and definitions of what “cheap” actually means. This kind of breadth isn’t noise, it’s a signal worth acting on.
Understanding how each fund differs under the hood helps investors decide which one belongs in their portfolio, and whether to own more than one.
Three Funds, Three Different Approaches to Value
The Vanguard Value Index Fund ETF (NYSE:VTV | VTV Price Prediction) is the broadest of the three funds listed today. Using CRSP value screens, it holds roughly 340 large-cap stocks trading at discounts across earnings, book value, sales, and cash flow.
This fund carries a trailing P/E/ of 21.46, a 2.02% yield, and an expense ratio of 0.03%, the lowest of the group. Net assets of around $225 billion make it one of the largest ETFs in existence today, and year-to-date it has returned 7.53%, with a one-year return of 28.97%.
The Vanguard Mega Cap Value Index Fund (NYSE:MGV) narrows the lens to the largest US companies that also screen as undervalued. With a P/E of 22.29, a 2.06% yield, and an expense ratio of 0.05%, this fund has returned 7.30% year-to-date and 27.87% over the past year.
Its five-year beta of 0.75 is the lowest of the three, offering real protection when markets turn volatile, and investors come searching for big-name stability without abandoning value.
The iShares MSCI USA Value Factor ETF (CBOE:VLUE) is a different animal entirely. Rather than screening for cheap stocks in traditional sectors, it uses MSCI factor scoring to identify undervalued companies relative to their own sector peers, including within technology. The result is a 37.42% allocation to tech, with Micron (NASDAQ:MU) leading at 8.89%.
The P/E of 18.35 is the lowest of the three, the expense ratio is only 0.15%, and the year-to-date return of 16.21% nearly triples that of the two other funds being discussed today. Better yet, its one-year return of 64.01% is pretty great for investors who stayed the course.
Where the Holdings Overlap, and Where They Don’t
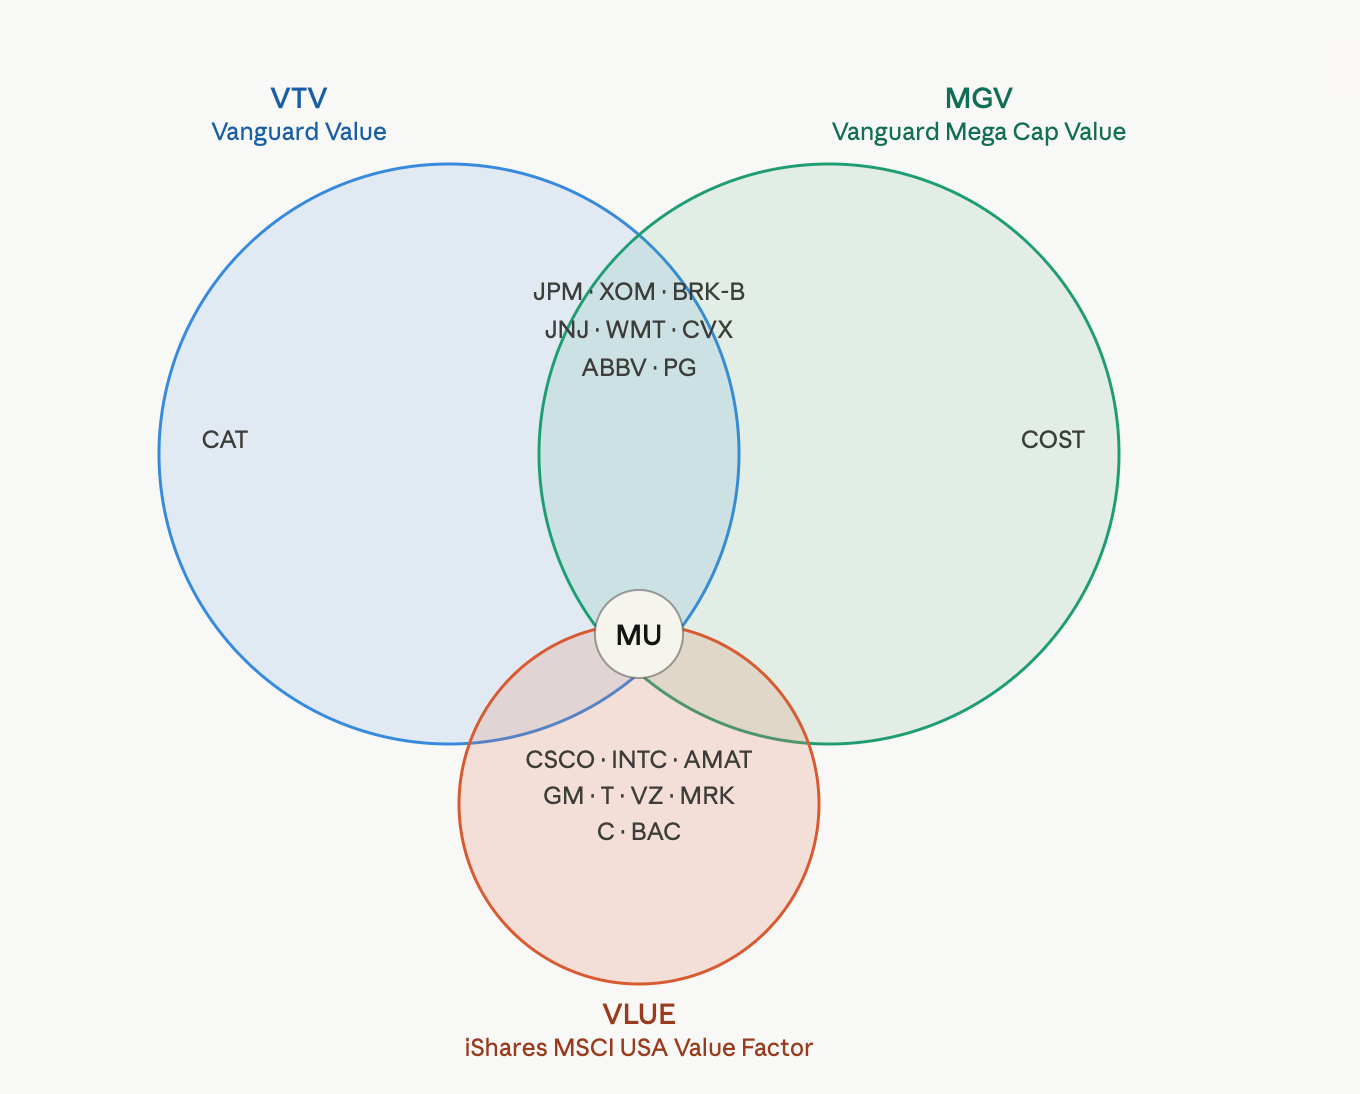
The Vanguard Value Index Fund ETF and the Vanguard Mega Cap Value Index Fund share much of the same core, including names such as JPMorgan Chase, Exxon Mobil, Berkshire Hathaway, Johnson & Johnson, Walmart, Chevron, AbbVie, and Procter & Gamble, all of which appear on both top-10 lists.
Sector tilts follow a nearly identical path as financials sit around 22-24%, healthcare at 15-18%, and industrials at nearly 14%. Owning both largely means you will double up on the same positions at slightly different levels of concentration.
On the other hand, the iShares MSCI USA Value Factor ETF is entirely different, as names like Micro, Cisco, Intel, Applied Materials, GM, AT&T, and Verizon dominate. This is a value fund that looks like a tech fund to the untrained eye, but the thesis is distinct as companies trading at a meaningful discount to sector peers on earnings, book value, and forward estimates.
Is the Value Rotation Cyclical or Structural?
The answer is likely both cyclically, value tends to outperform when rates stay elevated, and growth multiples compress, and these conditions still apply in 2026. Structurally, the gap between value and growth P/E ratios remains wide by historical standards even after recent compression, suggesting that repricing has further room to run.
Which Fund Fits Your Portfolio
Ultimately, the Vanguard Value Index Fund ETF is the default for most investors as it has the lowest cost, deepest liquidity, and the broadest exposure, making it the right core holding for anyone who wants a value tilt without complexity. On the other hand, the Vanguard Mega Cap Value Index Fund makes sense alongside it for investors who want lower volatility and a tighter focus on the biggest names, and the 0.75 beta is real protection if and when sentiment turns. Finally, the iShares MSCI USA Value Factor ETF is ideal for investors who want a more aggressive, factor-driven bet.