Unilever (NYSE:UL | UL Price Prediction) is trading at $58.53 as of writing, down 15.86% over the past year. Our 24/7 Wall St. price target for Unilever is $55.94, implying modest downside from current levels. Our recommendation is hold, with a confidence level of 90%.
| Metric | Value |
|---|---|
| Current Price | $58.53 |
| 24/7 Wall St. Price Target | $55.94 |
| Upside/Downside | -4.42% |
| Recommendation | HOLD |
| Confidence Level | 90% |
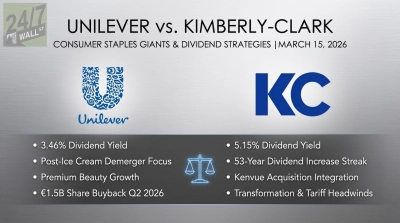
Unilever is a $127.8 billion consumer staples giant navigating a post-demerger reset. The stock trades near fair value, but risk-reward tilts toward caution at current levels.
Price Target Rationale
Our $55.94 price target sits modestly below current levels. The completed Ice Cream demerger sharpens the portfolio toward higher-growth categories, and a new €1.5 billion share buyback commencing in Q2 2026 provides a tangible floor. We’ve outlined a detailed bull case below showing reasons Unilever could outperform.
Recent Price Action
Unilever’s shares rose to $73.96 in February 2026 following Q4 2025 earnings but have since retreated sharply. The stock is down 9.83% year-to-date and 6.13% over the past month, trading well below its 52-week high of $74.41 and closer to its 52-week low of $54.95. Both the 50-day moving average of $65.24 and 200-day moving average of $67.17 now sit above the current price, a bearish technical setup.
Full-year 2025 results showed underlying sales growth accelerating to 4.2% in Q4, with underlying operating margin expanding 60 basis points to 20.0%. However, FY2025 EPS came in at $2.59 versus the consensus estimate of $2.93, a miss of 11.85%. Currency headwinds of 5.9% weighed on reported turnover and stranded overhead costs from the Ice Cream separation pressured profitability.
Bull Case: $76+
The bull case centers on Unilever’s sharpened portfolio following the Ice Cream exit. Power Brands representing 78% of turnover delivered 4.3% underlying sales growth in Q4 2025, with the Wellbeing segment posting double-digit growth for the 21st consecutive quarter.
Strategic acquisitions including Dr. Squatch, Wild, Minimalist, and full ownership of Nutrafol position the company in premium, high-margin categories. North America delivered 5.3% underlying sales growth with 3.8% volume growth in Q4, the strongest regional performance.
Analyst sentiment is constructive at Four of five analysts rate the stock Buy or Strong Buy, with a consensus target of $69.38. DZ Bank upgraded Unilever to Buy in April 2026, citing oversold conditions.
Our bull case projects $76.67 over 12 months, assuming currency headwinds ease, margin improvement accelerates beyond management’s “modest” 2026 guidance, and the new €1.5 billion buyback provides per-share EPS accretion.
Bear Case: Currency and Volume Risks
The bear case is straightforward. Currency headwinds cost Unilever 5.9% of reported turnover in FY2025, and with emerging market currencies under pressure, that drag may persist. Management guided for underlying sales growth only at the bottom end of the 4-6% multi-year range for 2026.
Weakness in China, Indonesia, Brazil, and Mexico represents a meaningful portion of revenue. Our bear case projects $53.01 over 12 months.
While quarterly earnings growth turned negative at 3.4% year-over-year and free cash flow declined in H1 2025, bulls argue this reflects one-time Ice Cream separation costs and demerger overhead rather than structural deterioration. Cumulative productivity savings of $670 million delivered ahead of schedule support improving underlying profitability.
Recommendation: Hold
Our $55.94 price target places Unilever near fair value with a trailing P/E of 19x and forward multiple of 16x. We recommend hold at 90% confidence. The dividend yield of 3.79% and consistent 3% annual dividend growth make this a reasonable income hold.
The hold thesis could strengthen if currency trends stabilize and Q1 2026 revenue meets the $12.45 billion consensus estimate. The hold thesis weakens if emerging market deterioration deepens or forward EPS of $2.35 faces further downward revision.
| Year | Base Case | Bull Case | Bear Case |
|---|---|---|---|
| 2026 | $55.94 | $76.67 | $53.01 |
| 2027 | $56.41 | $73.04 | $54.12 |
| 2028 | $55.66 | $84.60 | $53.00 |
| 2029 | $56.85 | $95.22 | $52.99 |
| 2030 | $58.82 | $109.34 | $55.55 |
These projections assume Unilever executes on its premium portfolio strategy and productivity program. Upside could result from sustained currency tailwinds and accelerating volume growth in North America and India. The bear case reflects prolonged emerging market headwinds and further EPS estimate compression.