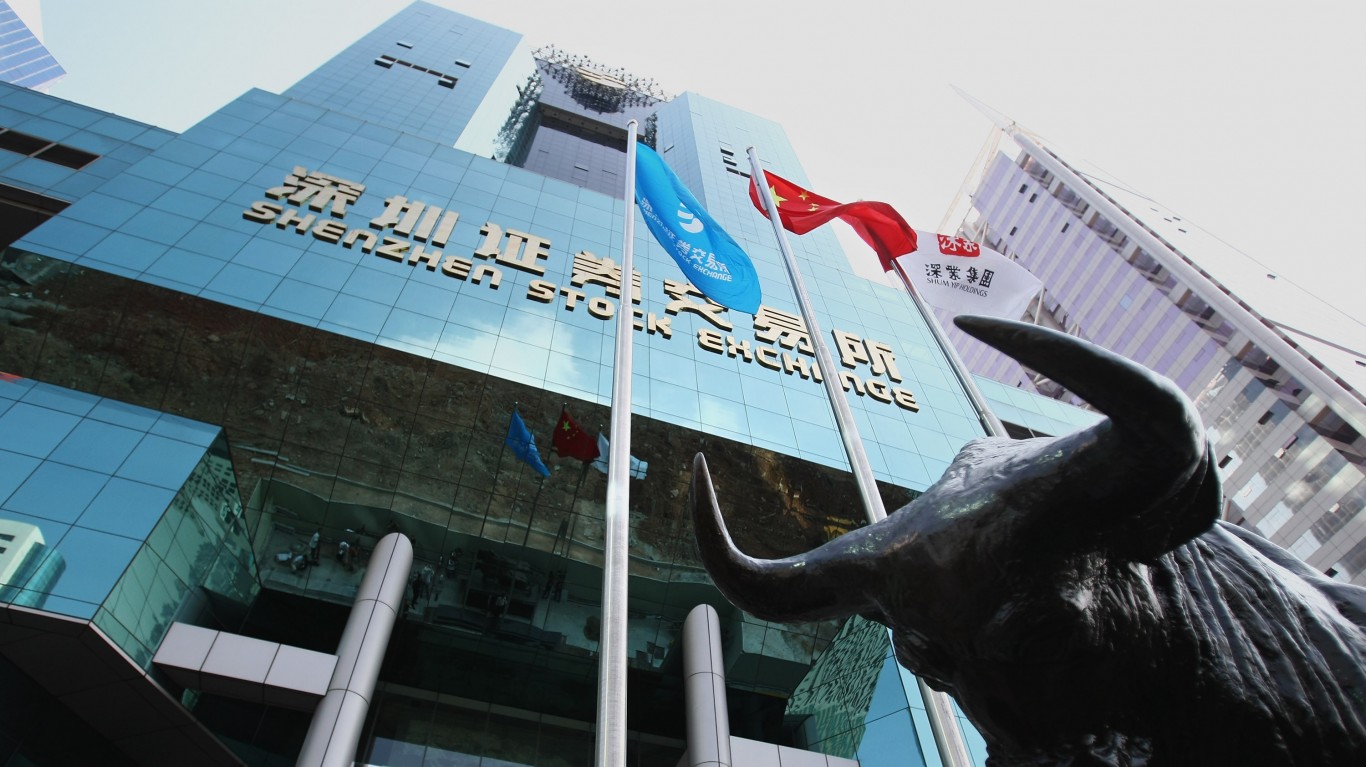
Chinese stocks have spent the last five years really testing the patience of even the most hardcore contrarians. Between the property sector struggles, the crackdown on tech platforms, and the constant friction over chip exports and tariffs, valuations have been pushed down across the board.
But that story is finally starting to change. In January, the GDP numbers for the end of 2025 came in at 4.5%, enough to help the government hit its 5% target for the year. This shift toward a moderate recovery, rather than a total collapse, is making people who had written off the market take a second look.
The three ETFs we are covering are the most popular ways to play this potential rebound. Each one gives you a different angle on China. You can go with broad market exposure, a specific bet on internet platforms, or a fund that tilts toward large, state-linked companies. Picking the right one is really just a matter of deciding which part of the recovery you believe in most.
MCHI: The Broadest Single-Country Core Position
The iShares MSCI China ETF (NASDAQ:MCHI | MCHI Price Prediction) is the most comprehensive single-fund way to own China. According to the iShares MCHI fact sheet, it tracks the MSCI China Index (Net) and includes A-shares via Stock Connect, H-shares listed in Hong Kong, and US-listed ADRs, which means the fund captures large-cap internet names, state-owned banks, insurers, consumer companies, and industrials in a single wrapper. Assets total $6.6 billion, and the expense ratio of 59 basis points is competitive for a dedicated single-country emerging-market fund.
The investment logic for a contrarian is straightforward. Sector weights tilt toward communication services at 20%, consumer discretionary at 14%, and technology at 8%, so the fund participates in domestic demand recovery, a platform-economy rerating, and any stabilization in bank balance sheets, without requiring a correct call on which of those three does the heavy lifting. Top holdings Tencent at 15% and Alibaba at 10% give the portfolio a clear mega-cap internet skew, balanced by positions in China Construction Bank, ICBC, Ping An, and BYD.
Performance tells the contrarian story. MCHI sits at $57, up 15% over the trailing year and roughly 47% from where it traded two years ago, yet it remains down about 22% over five years. The dividend yield of 2.2% is modest but real. The main caveat is that any single-country China fund carries concentrated geopolitical and currency risk, and Tencent and Alibaba together account for roughly a quarter of the portfolio.
KWEB: A Concentrated Bet on the Platform Economy
The KraneShares CSI China Internet ETF (NYSEARCA:KWEB) is the purest liquid vehicle for the China internet thesis. Per the KraneShares KWEB fund page, the fund tracks the CSI Overseas China Internet Index and concentrates exposure in e-commerce, search, short video, food delivery, and online travel. Consumer discretionary and communication services combined account for more than 83% of the portfolio, which is the point of owning it.
The mechanism linking KWEB to a rebound is narrower than that of MCHI. This fund works if Beijing’s posture toward platform companies continues to normalize, if antitrust enforcement stays predictable, and if consumer spending on the internet reaccelerates. Top holdings span the sector: Tencent at 10, Alibaba at 9%, PDD at 7%, Meituan at 7%, followed by Trip.com, Kanzhun, Kuaishou, and JD.com. Assets stand at roughly $6 billion, and the fund carries an expense ratio of 70 basis points.
KWEB is the most contrarian option on the list, trading around $28, down 55% over five years and essentially flat over a decade. Year to date, the fund is off about 16%, and the trailing twelve-month return is negative. The tradeoff here is concentration in every direction at once: sector, regulation, and ADR structure. Many holdings are variable interest entities listed in the US, which introduces a layer of delisting and conversion risk that broader China funds mute.
FXI: The Liquid, State-Linked Large-Cap Vehicle
The iShares China Large-Cap ETF (NYSEARCA:FXI) tracks the FTSE China 50 Index, covering the 50 largest Chinese companies listed in Hong Kong, according to the iShares FXI summary prospectus. Geographic allocation is 91% China, with Hong Kong at 7%, which, by construction, tilts the fund toward state-owned enterprises in banking, insurance, energy, and telecoms, alongside a sleeve of the same internet names found in MCHI. The expense ratio is 74 basis points, and FXI has traded since October 2004, making it the oldest and typically the most liquid China ETF.
FXI’s role in a contrarian portfolio is distinct from MCHI or KWEB. Its SOE weighting makes it more sensitive to Chinese fiscal stimulus, property-sector policy, commodity prices, and dividend payouts from banks, and less reliant on a platform rerating. It is also the fund most commonly used for tactical positioning because of deep options activity and tight spreads.
Shares trade around $36, up roughly 11% over the past year and about 54% from two years ago, while still down 12% over five years. The caveat is that FXI excludes A-shares entirely, so an investor using it is making an explicit bet on Hong Kong-listed state-linked champions rather than broad mainland equity exposure.
Choosing Among the Three
An investor wanting a single diversified line item for China exposure most naturally gravitates to MCHI, which spreads risk across sectors, share classes, and listing venues. KWEB takes a narrower view, arguing that the platform economy is the part of China most mispriced after the regulatory reset. FXI suits tactical or income-oriented positioning tied to state-owned enterprises, stimulus, and Hong Kong-listed large caps, and is the most common vehicle for options-based expressions of a China view.