Passive investing’s central promise is hard to argue with: low costs, broad diversification, and returns that match the market. Vanguard built an empire on that promise, and funds like the Vanguard Growth ETF (NYSE:VUG | VUG Price Prediction), the Vanguard FTSE Developed Markets ETF (NYSE:VEA), and the Vanguard Small-Cap ETF (NYSE:VB) remain among the most widely held in the world.
What is less discussed is that Fidelity has spent years building actively managed counterparts to each of those funds, and each one is making the case for a different approach. The Fidelity Enhanced Large Cap Growth ETF (NYSE:FELG), the Fidelity Enhanced International ETF (NYSE:FENI), and the Fidelity Enhanced Small Cap ETF (NYSE:FESM) all use computer-aided stock selection to tilt away from pure index weighting toward companies with stronger fundamentals, better momentum, or more favorable valuations within their respective universes.
The expense difference versus Vanguard is real, but narrower than most investors assume, and the performance gap in at least two of the three matchups is worth examining.
The Performance Comparison
| Fund | YTD | 1-Year | Expense Ratio |
| Fidelity Enhanced Large Cap Growth ETF | 1.91% | 33.13% | 0.18% |
| Vanguard Growth ETF | 3.25% | 33.59% | 0.03% |
| Fidelity Enhanced International ETF | 7.87% | 31.06% | 0.28% |
| Vanguard FTSE Developed Markets ETF | 10.19% | 34.09% | 0.03% |
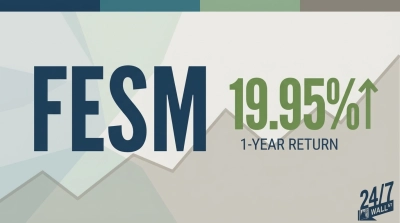
| Fidelity Enhanced Small Cap ETF | 16.32% | 54.01% | 0.28% |
| Vanguard Small-Cap ETF | 10.83% | 33.60% | 0.03% |
Large Cap Growth: Essentially a Draw
The Fidelity Enhanced Large Cap Growth ETF and the Vanguard Growth ETF hold nearly identical names at the top of their portfolios. NVIDIA, Apple, Microsoft, Broadcom, and Amazon dominate both sides.
The one-year return gap is less than half a percentage point, and the Vanguard fund sits slightly ahead at 33.59% versus 33.13%. Year to date, the Vanguard fund leads by 1.34%, while the Fidelity fund charges 0.18% versus Vanguard’s 0.03%, a 15-basis-point gap that has not produced meaningful active alpha in this matchup.
For large-cap growth exposure, the Vanguard Growth ETF’s cost advantage is hard to overcome when the portfolios are this similar.
International Developed Markets: Vanguard Wins on Returns, Fidelity on Concentration
The Fidelity Enhanced International ETF holds 406 stocks compared with the Vanguard FTSE Developed Markets ETF’s 3,906, reflecting a deliberately concentrated active approach focused on the MSCI EAFE universe.
Top holdings include ASML Holdings, Roche Holding, HSBC, and Siemens. The Vanguard fund is winning on both YTD return at 10.19% versus 7.87% and one-year return, with 34.09% gains against Fidelity’s 31.06%. The Fidelity fund charges 0.28% versus 0.03%, but the big caveat is that this is the weakest active-management case of the three, at least in the current period.
Vanguard’s broader exposure has outperformed Fidelity by roughly 3% over the past year, so it’s a pretty strong case in favor.
Small Cap: The Strongest Active Case
The Fidelity Enhanced Small Cap ETF is where the active management argument becomes genuinely compelling. The fund has returned 54.01% over the past year, compared with the Vanguard Small-Cap ETF’s 33.60%, an outperformance of more than 20%.
Year to date, the Fidelity fund leads by 5.49% at 16.32% against Fidelity’s 10.83%. The Fidelity fund tracks the Russell 2000 universe, but applies computer-aided selection to tilt toward companies with better fundamentals, and the results in small-cap stocks, where index construction is less efficient and active screens can add more value, have been substantial.
At 0.28% versus 0.03%, investors are paying 25 basis points for over 20 points of additional one-year return.
Is the Active Premium Worth It?
In large-cap growth and international developed markets, the answer right now is no. The Fidelity funds in those categories are not adding enough alpha to justify even a modest fee premium over Vanguard’s near-free passive alternatives.
In the small-cap space, the answer is more clearly yes, at least over recent periods. The Fidelity Enhanced Small Cap ETF’s active selection in a less efficient universe has produced returns that dwarf the fee difference, and that is the matchup where Fidelity’s enhanced approach has made the strongest case for itself.