FFLG has returned 44% over the past year, beating both the S&P 500 and Nasdaq 100 over the same stretch. That kind of outperformance from an actively managed fund with $521 million in assets would normally generate headlines. Instead, most growth investors default to passive index funds and never look twice at what Fidelity is doing here.
Fidelity’s “Best Ideas” Engine in ETF Form
Fidelity Fundamental Large Cap Growth ETF (NYSEARCA:FFLG) is designed to fill one role: core large-cap growth exposure powered by active stock selection. The fund invests at least 80% of its assets in equity securities of companies with large market capitalizations that Fidelity Management & Research Company LLC believes have above-average growth potential. Its benchmark is the Russell 1000 Growth index.
The return engine is straightforward: Fidelity’s research team, one of the largest on Wall Street, identifies its highest-conviction growth names and concentrates the portfolio around them. There are no options overlays, no leverage, no derivatives. The fund makes money when its stock picks appreciate faster than what a passive index would deliver. Having some active ETF holdings in this current environment is sensible, and Fidelity’s researchers are considered among the best on Wall Street, trying to guide the ship through a storm.
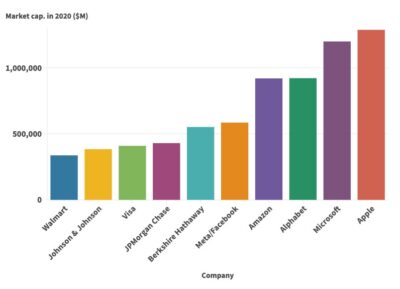
The concentration reflects that conviction. NVIDIA (NASDAQ:NVDA | NVDA Price Prediction) alone represents about 15% of the portfolio, with Apple (NASDAQ:AAPL) at 8%, Amazon (NASDAQ:AMZN) at 6%, and Microsoft (NASDAQ:MSFT) at 6%. Information Technology accounts for roughly 50% of the fund, and Communication Services adds another 17%. This is a deliberate bet that the fastest-growing businesses in the economy deserve outsized portfolio weight.
FFLG Has Beaten the Nasdaq Recently, but Trailed It Over Five Years
Over the trailing year through April 10, FFLG returned 44%. The SPY (NYSEARCA:SPY) returned 30%, and QQQ (NASDAQ:QQQ) returned 37% over the same period. FFLG outpaced both the Nasdaq 100 and the broad market by a meaningful margin. Active management earned its fee.
The five-year view tells a different story. FFLG returned 54% since April 2021, while QQQ returned 81% and SPY returned 65%. That gap versus QQQ represents the real cost of active management through the 2022 drawdown and recovery cycle. Investors who held a passive growth index came out well ahead over the full period, even though FFLG has been winning recently.
Concentration, Cost, and Turnover: What Active Management Costs You
- Concentration risk is real. When your largest holding is 15% of the fund, a single stock’s bad quarter can drag the entire portfolio. FFLG’s year-to-date return is essentially flat, partly because mega-cap tech has struggled in early 2026. The same conviction that drives outperformance amplifies drawdowns.
- The expense ratio is cheap for active, expensive for growth. At 0.38%, FFLG costs a fraction of what traditional active mutual funds charge. Compared to a Vanguard or Schwab passive growth index fund at 0.04%, the gap compounds over decades. That math only works if the manager keeps delivering.
- Low turnover cuts both ways. Portfolio turnover of 52% signals patient, conviction-driven management. It also means the fund can be slow to exit positions that deteriorate. In fast-moving markets, patience can become stubbornness.
No Income, No International Exposure: FFLG Is a Pure Growth Bet
The dividend yield is essentially zero, so income investors should look elsewhere. Geographic exposure is 94% U.S., so this adds no international diversification. FFLG is a pure capital appreciation vehicle for investors who want growth exposure with a human making the calls instead of an algorithm rebalancing to an index.
Investors with a decade-plus horizon who believe in Fidelity’s fundamental research may find FFLG worth evaluating as a growth core, though the strategy requires tolerance for extended periods of underperformance relative to passive indexes.