The average American earns between $60,000 and $65,000 a year. That number is also a common income replacement target for dividend portfolio builders. The math behind hitting it is straightforward. The portfolio decisions require careful tradeoffs across yield, risk, and time horizon.
At three different yield levels, generating $60,000 a year from investments alone requires vastly different amounts of capital.
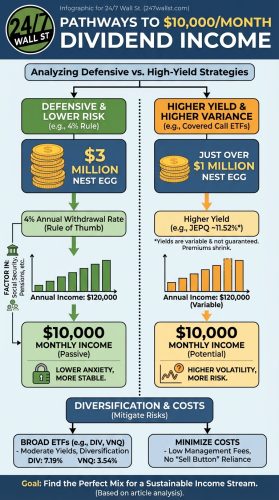
The Conservative Foundation: 3% to 5% Yield
This tier holds dividend growth stocks, broad equity funds, and net lease REITs. Income is steady, dividends tend to grow over time, and principal is likely to appreciate alongside it.
Realty Income Corporation (NYSE:O | O Price Prediction), the self-described “Monthly Dividend Company,” is the archetype here. Its annualized dividend is approximately $3.24 per share, and at a current price near $63, that works out to a yield of roughly 5.1%. The company has raised its dividend 113 consecutive quarters and paid monthly distributions for 665 consecutive months.
At a 3.5% yield, $60,000 divided by 0.035 equals approximately $1,714,000 in required capital. At 5%, that equals $1,200,000. Both represent portfolios where underlying assets are likely to hold or grow their value over time. The tradeoff: you need significant capital upfront, and income alone will not make you rich. What it will do is keep pace with inflation over decades, which most high-yield alternatives cannot claim.
Higher Yield, Lower Capital: The 6% to 8% Tier
This tier covers higher-yield equities, preferred shares, covered call ETFs, and certain business development companies. The capital requirement drops meaningfully. So does the likelihood that your income will grow.
Main Street Capital Corporation (NYSE:MAIN) is a business development company focused on lower middle-market lending. It pays $0.26 per month in regular dividends plus $0.30 quarterly supplemental distributions, which annualizes to roughly $4.32 per share. At a current price near $53, that is a yield around 8.1%. Main Street has raised its regular monthly dividend 11 times since late 2021 and paid 18 consecutive quarterly supplementals.
At 7% yield, $60,000 divided by 0.07 equals approximately $857,000. That is more achievable for many investors. The catch: distributions from this tier are more sensitive to interest rate cycles, and some strategies cap price appreciation. Main Street’s floating-rate exposure means the Fed’s current rate of 3.75%, down from 4.50% a year ago, puts mild pressure on net interest income.
Double-Digit Yields: What BDCs and High-Yield Funds Actually Cost You
This is where income looks most compelling and risks are highest. Leveraged covered call funds, mortgage REITs, and high-yield BDCs populate this tier. Capital required to generate $60,000 drops sharply. So does the probability that your portfolio will be worth the same amount in ten years.
Two examples sit here. Capital Southwest Corporation (NASDAQ:CSWC) is a Dallas-based BDC specializing in middle-market debt financing. Its current annualized dividend runs approximately $2.56 per share, and at a price near $23, the yield is roughly 11.2%. Its portfolio is 95% floating rate, meaning income is tied directly to benchmark rates.
British American Tobacco p.l.c. (NYSE:BTI) offers a different flavor of high yield. Its 2026 annualized dividend is approximately $3.34 per share, and at a price near $59, that yields roughly 5.7% on the reported figure, though the company’s ADR structure and quarterly payment schedule mean foreign withholding taxes can reduce what U.S. investors actually receive).
At 11% yield, $60,000 divided by 0.11 equals approximately $545,000. Many investors can reach that number. The problem: at this yield level, the portfolio is often spending itself down. Principal erosion is common, distributions get cut during downturns, and the investor ends up with less capital than they started with even after collecting years of income.
Why a Lower Starting Yield Can Produce More Income Over Time
A 3.5% yield that grows its dividend 6% annually doubles the income in roughly 12 years. The same $60,000 becomes $120,000 without adding a dollar of new capital. A 12% yield with no dividend growth stays flat, or more likely, declines. The investor chasing maximum current income often ends up with less income in year ten than the investor who accepted a lower starting yield.
Lower yields frequently produce better long-term income outcomes. The math only looks unfavorable at the start.
Before You Build: Tax, Spending, and the Compounding Test
- Calculate your actual spending, not your salary. After taxes, retirement contributions, and work-related costs, most people need to replace 70% to 80% of gross income, not 100%. Your real target may be $45,000 or $50,000, which changes every tier’s capital requirement significantly.
- Model the tax impact of each tier. BDC distributions are often taxed as ordinary income. REIT dividends can be partially sheltered by the 20% pass-through deduction. ADR dividends may be subject to foreign withholding. The after-tax yield is what you actually spend.
- Compare 10-year total return, not just current yield. A dividend growth portfolio at 3.5% yield may deliver more total income over a decade than a 10% portfolio whose principal has eroded by 30%. Run the compounding math before locking into the highest-yield option.