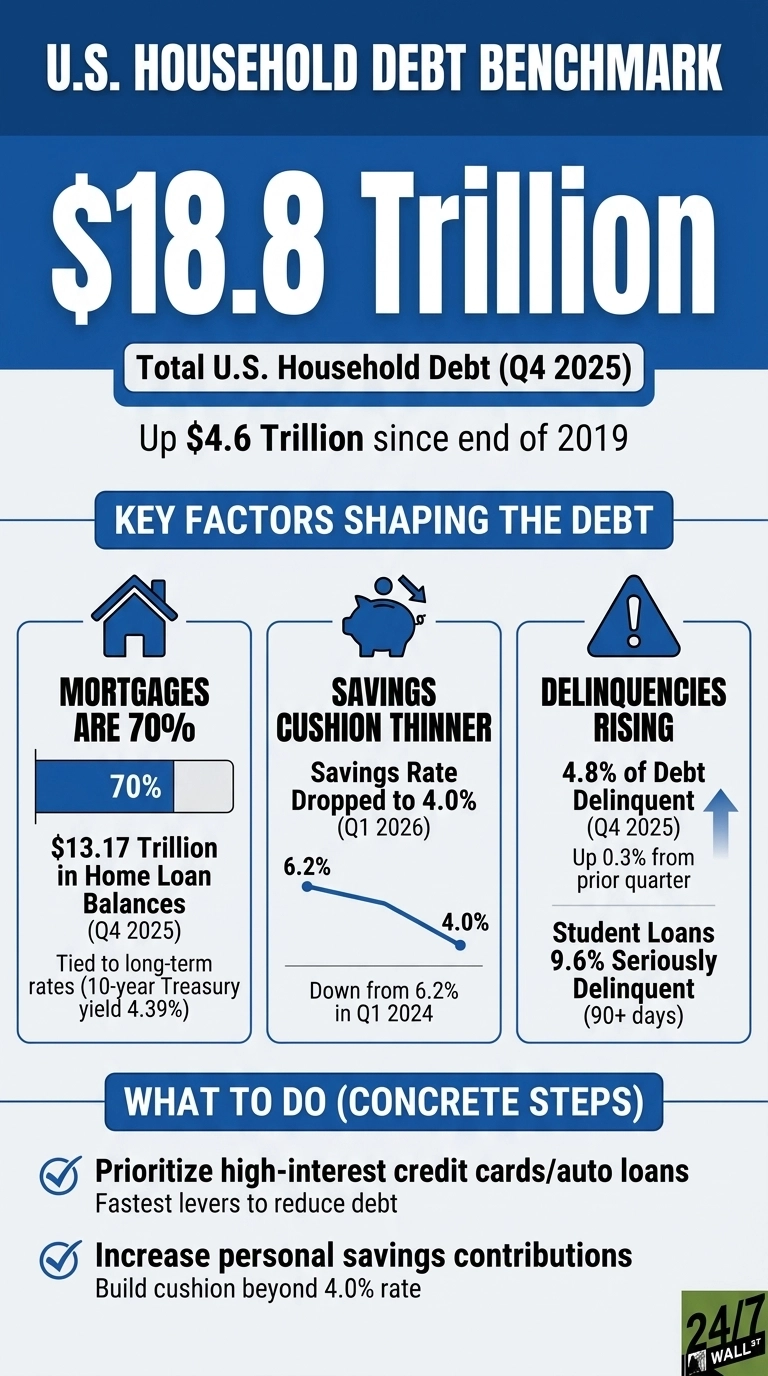
American households closed out 2025 owing $18.8 trillion, and that number did not get there by accident. Debt has climbed by $4.6 trillion since the end of 2019, a borrowing pace that would have been difficult to imagine before the pandemic scrambled every assumption households had about spending, saving, and what financial stability actually looks like. The headline figure is striking on its own, but the more interesting story is in the composition, because not all of that debt is sitting in the same place, and the pressure it is creating is landing very differently depending on which category you are looking at and where you are in your financial life.
Where the $18.8 trillion actually lives
Mortgages are doing the heavy lifting, and the math is hard to ignore. Home loan balances closed December 2025 at $13.17 trillion, with another $433 billion in home equity lines of credit that have climbed for fifteen straight quarters without once looking back. Seven out of every ten dollars Americans owe is tied to a house. This is not just a real estate story. It is the defining story of the American balance sheet.
But the non-housing numbers are where things start to get ugly. Credit card balances punched through $1.28 trillion, up 5.5% in a single year, while auto loans landed at $1.66 trillion. These are the categories that hit hardest when household budgets get tight, and for a growing number of Americans, tight is exactly where things stand right now.
The cushion is getting thinner
The savings rate tells the story that the debt numbers only hint at. Americans are earning more and saving less, with the personal savings rate sliding from 6.2% two years ago to 4.0% today, even as disposable income has climbed. That gap between earning more and keeping less has to go somewhere, and for millions of households, it is going straight onto a credit card. Retail spending remains strong, which sounds like good news until you realize that a meaningful chunk of it is being financed rather than funded.
Inflation is the quiet accelerant beneath it all. The Fed’s preferred inflation gauge, core PCE, is running near the top of its recent range, which means the purchasing power that households thought they were gaining from higher wages is getting quietly eroded before it ever hits the bank account. Earning more, saving less, spending more, and watching prices stay stubbornly high is not a formula that ends well for anyone trying to build something durable.
Delinquencies are the early warning
Nearly one in twenty dollars of outstanding debt is already behind, and the trend is moving in the wrong direction. Delinquency across all categories hit 4.8% at the end of December 2025, and student loans are in significantly worse shape, with nearly one in ten dollars seriously past due as pandemic forbearance arrangements finally run out and borrowers discover what repayment actually costs them every month.
What makes this harder to dismiss is the labor market backdrop. People are working. Unemployment sits in healthy territory, and jobless claims recently hit a one-year low. Stress is building not because people are losing their jobs, but because the cost of everything else has outrun the paychecks that were supposed to cover it.
Consumer sentiment says the same thing in a different way. The University of Michigan index has dropped deep into pessimistic territory, sitting well below the threshold economists associate with recessionary readings. Americans are still spending, still borrowing, and still showing up to work, but they feel worse about their financial lives than the headline numbers would suggest. That gap between the data and the mood is exactly the kind of thing that tends to matter more over time than it does in the moment.
What this means for retirement and long-term wealth
The report cleanly supports the debt composition and delinquency data. Here is what it can carry on its own for that section:
Every dollar going to interest is a dollar that never reaches a savings account or a retirement fund, and the New York Fed data makes clear just how many dollars are heading in that direction. Credit card balances have crossed $1.28 trillion and are growing at 5.5% annually. Student loan delinquency is running at 9.6%. Overall delinquency ticked up again in the fourth quarter. These are not isolated data points. They are a pattern, and the pattern points toward a growing share of household income being consumed by debt service before it ever has a chance to compound.
The composition of the debt tells you where the leverage is. Fixed-rate mortgage balances are largely locked in place until rates fall enough to make refinancing worthwhile, so that portion of the stack sits mostly beyond immediate reach. Credit cards and auto loans are where action actually moves the needle, and both categories have been climbing. For any household trying to build real financial momentum, the debt stack is the first obstacle standing between where things are today and where they need to be.