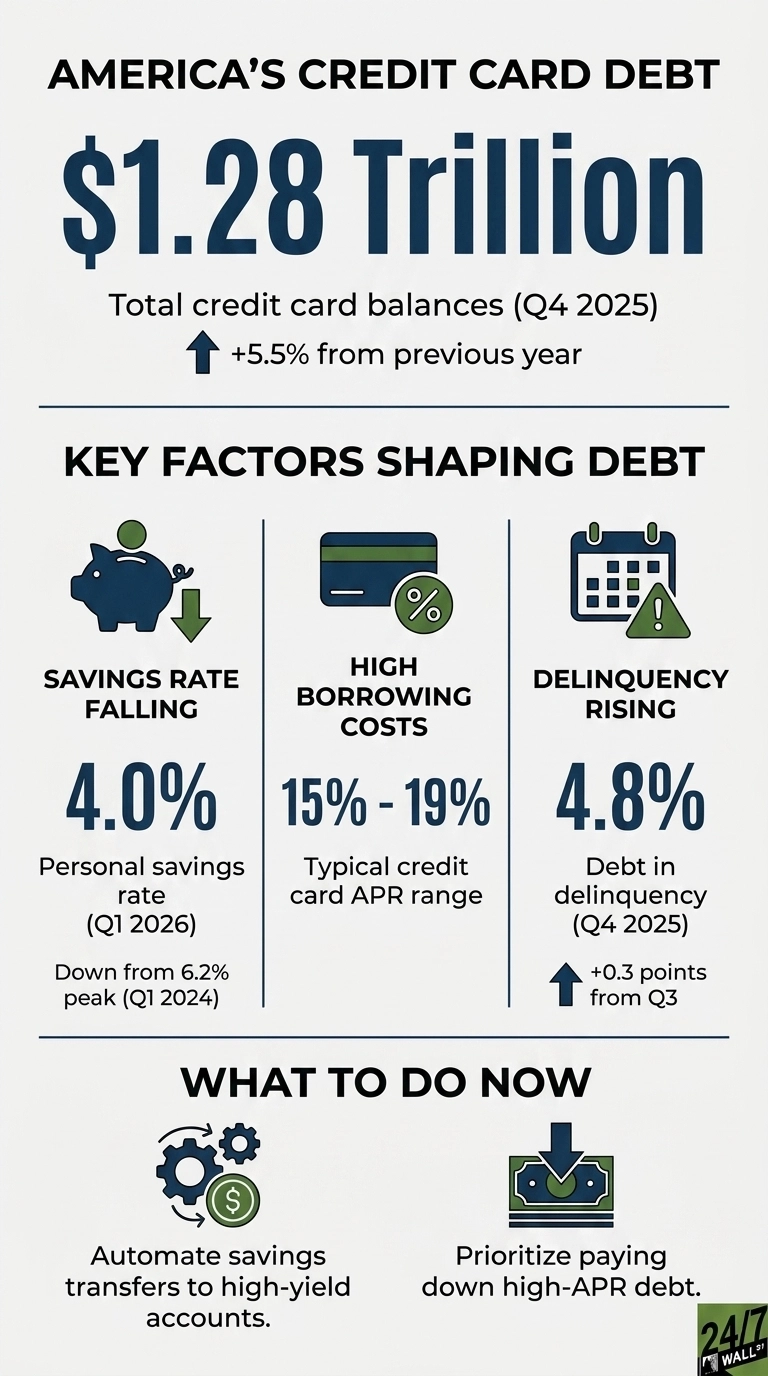
Credit cards carried the load in Q4 as Americans piled another $44 billion onto their balances, pushing the total to $1.28 trillion, a 5.5% jump from last year. The New York Fed’s Q4 2025 report shows households leaning on revolving credit to keep their budgets intact, and the strain is starting to show. The strategy is running out of runway.
The savings rate is doing the explaining
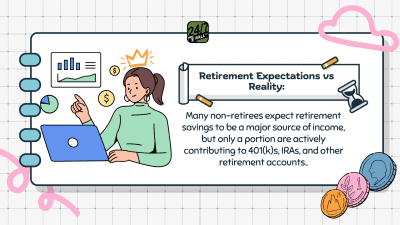
Personal income keeps rising, but it is not giving households the breathing room they should. Disposable personal income hit $23,506.8 billion in Q1 2026, up from $22,563.7 billion a year earlier. At the same time, the personal savings rate slid to 4.0% in Q1 2026, down from 6.2% in early 2024. People are earning more, saving less, and the shortfall is landing right on their credit cards.
Prices are the reason everything feels tighter. The Consumer Price Index reached 330.3 in March 2026, a 1.1% jump from the prior month and the twelfth straight monthly increase. Spending on housing climbed to $3,904.5 billion at an annual rate in March 2026. Housing is not something anyone can cut, and when its cost rises faster than wages, the credit card steps in to take the hit.
The cost of carrying that balance
The Federal Reserve has lowered its target rate to 3.75% from the 4.5% peak in September 2025 and has held it there for about five months. That shift offers a little relief, but credit card APRs still sit in the 15% to 19% range because issuer margins stacked on top of the prime rate keep borrowing costs high. A balance carried at 18% quietly doubles the price of whatever was bought in roughly four years if the minimum payment is all that ever goes in.
Delinquency is catching up
Delinquency continued to rise through the end of 2025, with 4.8% of all household debt in the late‑payment pipeline, up 0.3 percentage points from Q3. Student loans are carrying the most heat, with 9.6% of balances 90 or more days late as payment reporting continues to restart. Total household debt reached $18.8 trillion, and the pace of borrowing is outrunning what many families can comfortably service.
Consumer sentiment is reflecting that pressure. The University of Michigan index landed at 53.3 in March 2026, 5.5% below February and deep inside the recession zone the survey defines as anything under 60. Unemployment held steady at 4.3%, which makes the gloom stand out even more. Households are reacting to the math of their monthly budget rather than the stability of the job market.
The structural alternative
A budget built on revolving credit sends the first cut straight to the bank. A budget built on income‑producing assets sends the first cut back to the household. Carrying $10,000 at 18% drains roughly $1,800 a year in interest. Holding $10,000 in a Treasury money market fund or a short‑duration bond fund yielding around 4% throws off roughly $400. The swing between paying interest and earning it on the same dollar clears $2,000 a year.
Two structural habits change that math. One is to automate the transfer of any monthly surplus into a high‑yield savings account or money market fund before it ever touches checking, removing temptation from the process.
The other is the return on debt paydown, because every dollar pushed into a credit card balance with a double‑digit APR avoids a 15% to 19% drag on net worth. Retail sales hit a record $752.1 billion in March 2026, so the spending engine is still running. The real question for any household is whether that engine is running on income or on debt, and whether the asset side of the balance sheet is doing any work at all.