24/7 Wall St. Insights
- This election cycle, Harris and Trump campaigns are focusing their resources on a handful of key swing-states, where the election will likely be decided.
- In most of the rest of the country, including Massachusetts, the outcome of the race is effectively predetermined.
- Massachusetts’ status as a Democratic stronghold is evidenced, in part, by historical voting patterns in several deep-blue counties.
- Also: Discover the next Nvidia
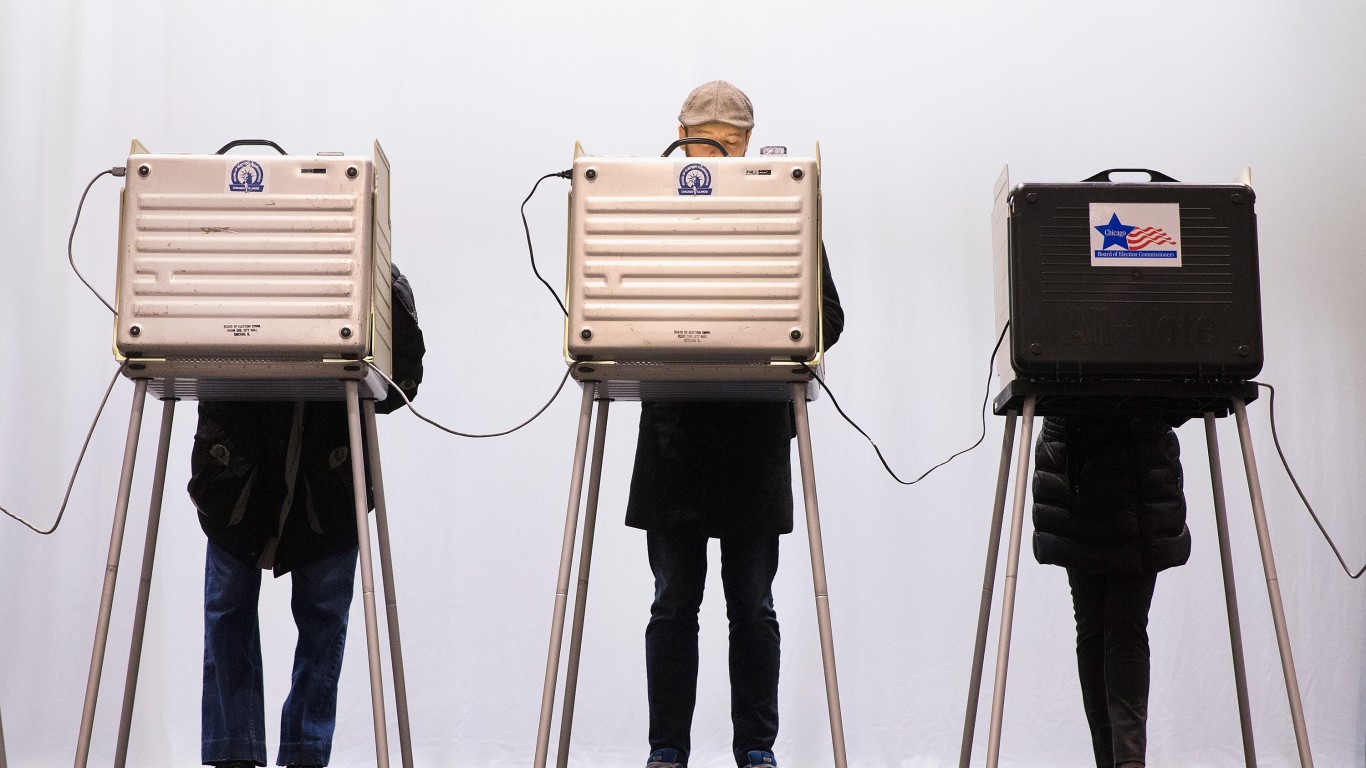
With Election Day less than eight weeks out, the two major party candidates — Democrat Kamala Harris and Republican Donald Trump — are locked in a closely contested race. Harris is leading her opponent, with support from 49% of voters compared to Trump’s 47%, according to a New York Times analysis of major national polls. These numbers are expected to shift right up until the election, but even if Harris maintains her slim advantage in the national polls, a Democratic victory is by no means guaranteed. (Here is a look at which Americans are most likely to vote for Kamala Harris.)
In keeping with the pattern of other recent presidential elections, the outcome of the 2024 race will likely come down to a handful of so-called swing, or battleground states. The most competitive states in this election cycle are Arizona, Georgia, Michigan, Nevada, North Carolina, Pennsylvania, and Wisconsin. In these places, the candidates are polling so closely that either one has a reasonable chance of winning in November. As a result, both campaigns are focusing their resources in these places. (This is how Trump and Harris are polling in every key swing state.)
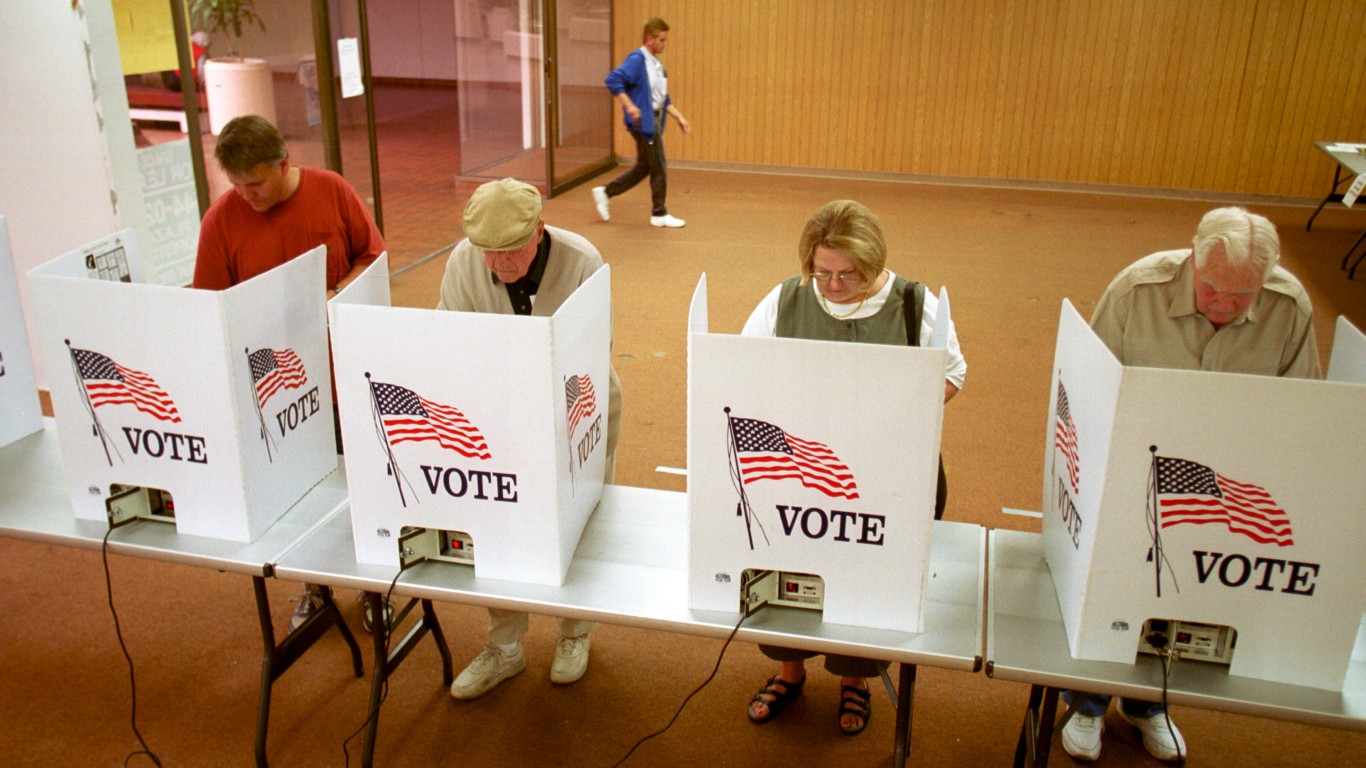
In stark contrast to these battleground states, most other states are considered a virtual lock for either Trump or Harris. Based on current polling results, political affiliation of the electorate, and historical voting patterns, Massachusetts is one of these states. According to official records from the Federal Election Commission, the last time Massachusetts went to a Republican candidate was in 1984, when the GOP’s Ronald Reagan defeated Walter Mondale, a Democrat.
Massachusetts’ status as a Democratic stronghold is driven by voters in certain parts of the state. There are 14 counties in Massachusetts where, over the last four presidential elections, an average of at least 50% of voters have cast a ballot for the Democratic candidate.
If historical patterns hold up this election year, these same counties will help deliver Massachusetts and its 11 electoral votes to Harris in November 2024. All historical, county-level, voting statistics are from the MIT Election Data and Science Lab’s County Presidential Election Returns 2000-2020 database, as compiled in the Harvard Dataverse, V13.
These are the most Democratic counties in Massachusetts.
Why It Matters
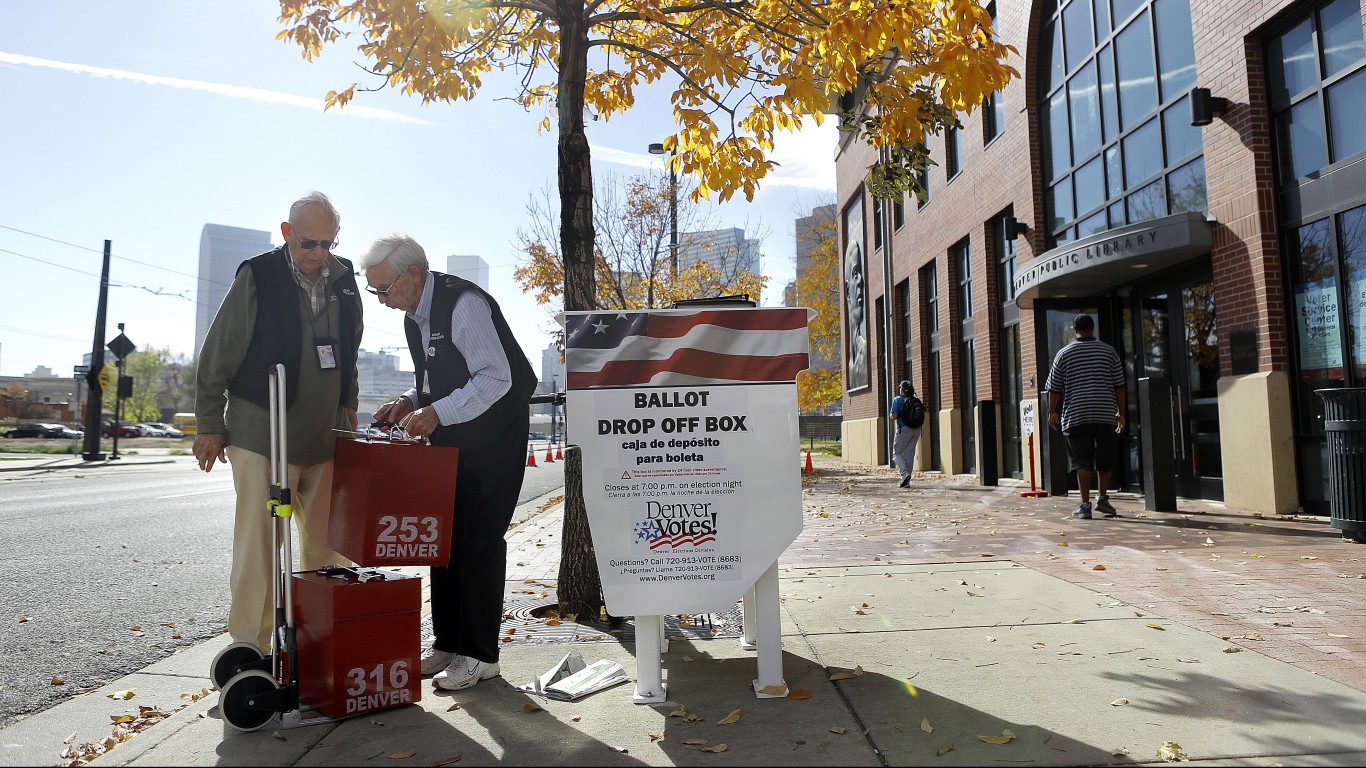
Because of the electoral college system, the outcome of presidential elections often comes down to voters in just a handful of closely contested states. In contrast to these battleground states, most of the country has reliably voted either Democratic or Republican in recent presidential elections. These states include Massachusetts, which, barring any unforeseen shake ups in the race, is all but guaranteed to go to Harris in 2024. Outcomes in states like Massachusetts are driven, in part, by party strongholds at the county-level.
14. Plymouth County

- Average popular vote split in last 4 presidential elections: 53.2% Democratic; 43.7% Republican
- Popular vote split in 2020 election: 57.1% Democrat (Joe Biden); 39.9% Republican (Donald Trump)
- Popular vote split in 2016 election: 50.8% Democrat (Hillary Clinton); 43.2% Republican (Donald Trump)
- Popular vote split in 2012 election: 51.4% Democrat (Barack Obama); 47.2% Republican (Mitt Romney)
- Popular vote split in 2008 election: 52.8% Democrat (Barack Obama); 45.2% Republican (John McCain)
- County population: 529,548
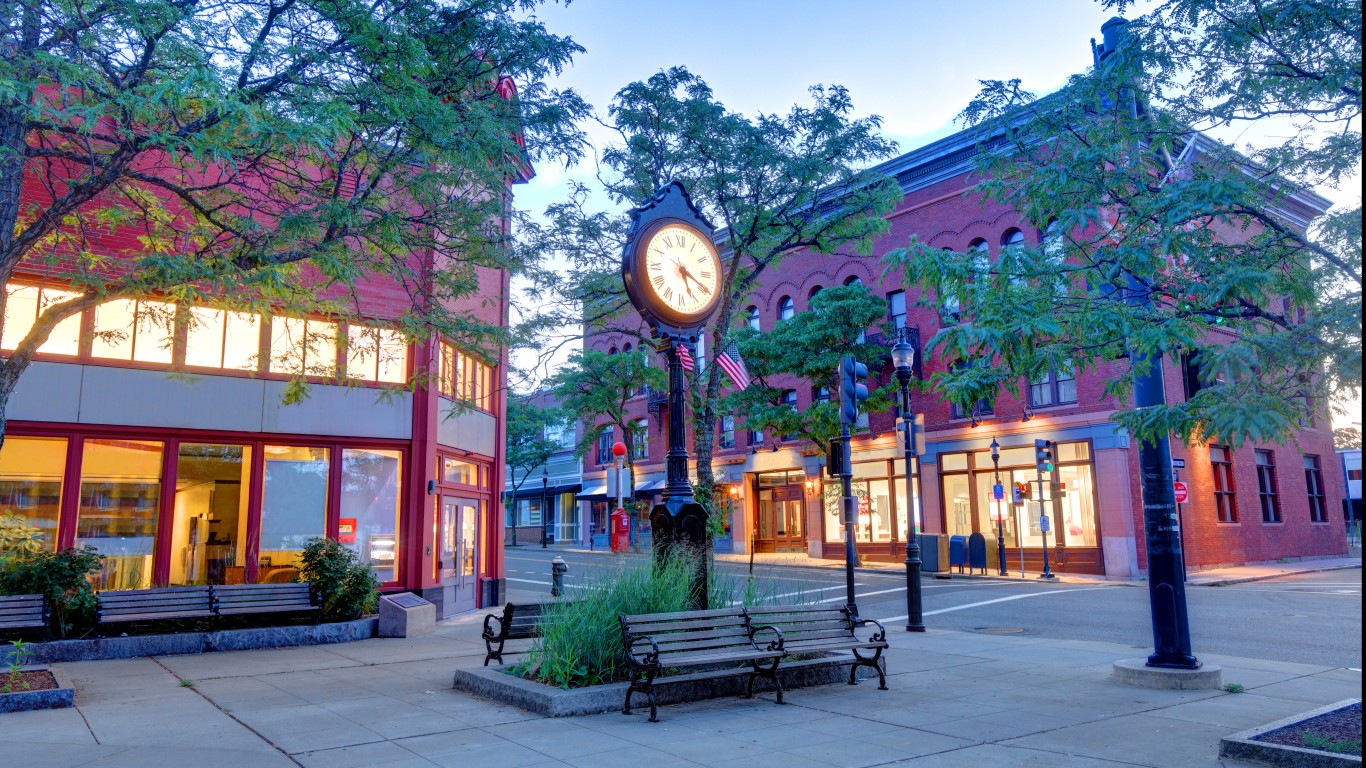
13. Worcester County
- Average popular vote split in last 4 presidential elections: 54.7% Democratic; 41.6% Republican
- Popular vote split in 2020 election: 57.2% Democrat (Joe Biden); 39.5% Republican (Donald Trump)
- Popular vote split in 2016 election: 51.8% Democrat (Hillary Clinton); 41.1% Republican (Donald Trump)
- Popular vote split in 2012 election: 53.7% Democrat (Barack Obama); 44.3% Republican (Mitt Romney)
- Popular vote split in 2008 election: 55.6% Democrat (Barack Obama); 41.8% Republican (John McCain)
- County population: 858,898
12. Barnstable County
- Average popular vote split in last 4 presidential elections: 56.2% Democratic; 41.0% Republican
- Popular vote split in 2020 election: 60.7% Democrat (Joe Biden); 36.5% Republican (Donald Trump)
- Popular vote split in 2016 election: 54.1% Democrat (Hillary Clinton); 40.4% Republican (Donald Trump)
- Popular vote split in 2012 election: 53.2% Democrat (Barack Obama); 45.4% Republican (Mitt Romney)
- Popular vote split in 2008 election: 56.1% Democrat (Barack Obama); 42.1% Republican (John McCain)
- County population: 229,436
11. Bristol County
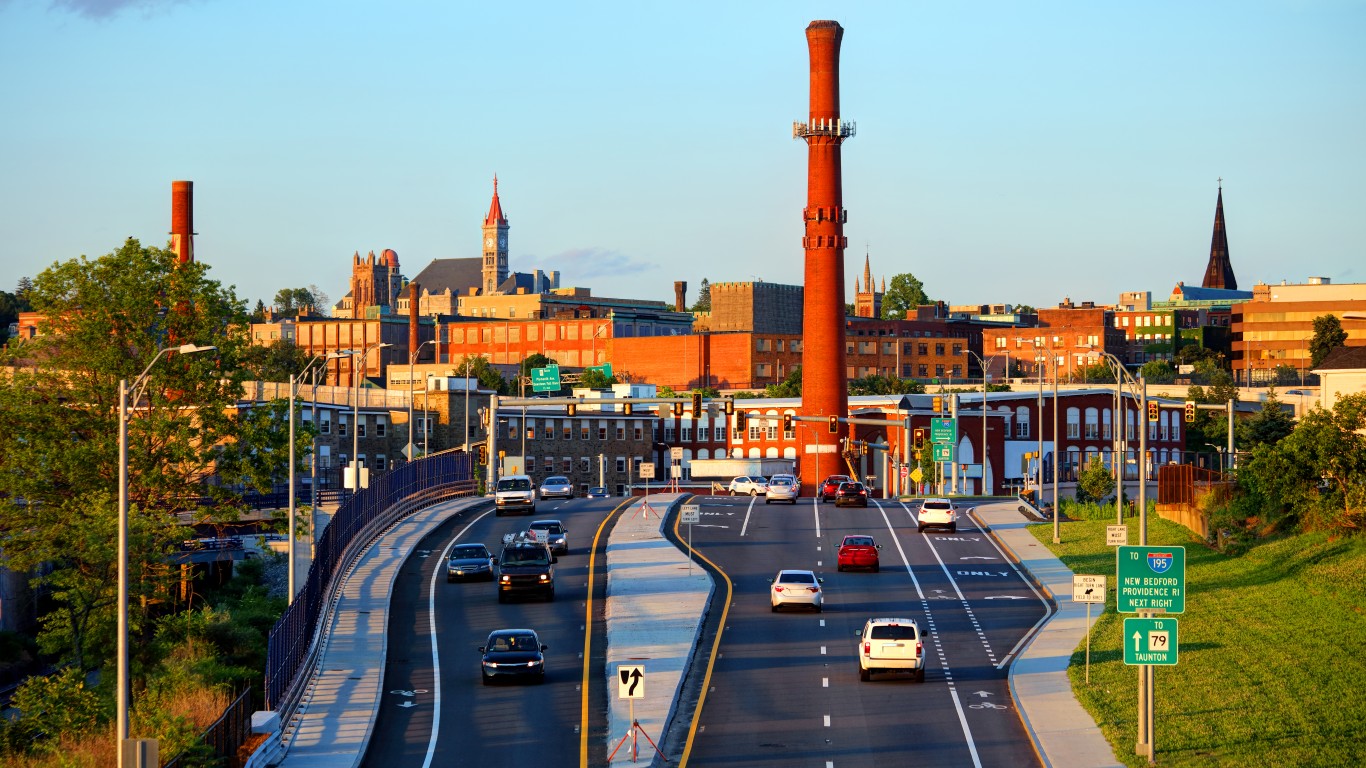
- Average popular vote split in last 4 presidential elections: 56.4% Democratic; 40.4% Republican
- Popular vote split in 2020 election: 54.5% Democrat (Joe Biden); 42.6% Republican (Donald Trump)
- Popular vote split in 2016 election: 52.0% Democrat (Hillary Clinton); 42.4% Republican (Donald Trump)
- Popular vote split in 2012 election: 59.2% Democrat (Barack Obama); 38.8% Republican (Mitt Romney)
- Popular vote split in 2008 election: 60.4% Democrat (Barack Obama); 37.3% Republican (John McCain)
- County population: 576,699
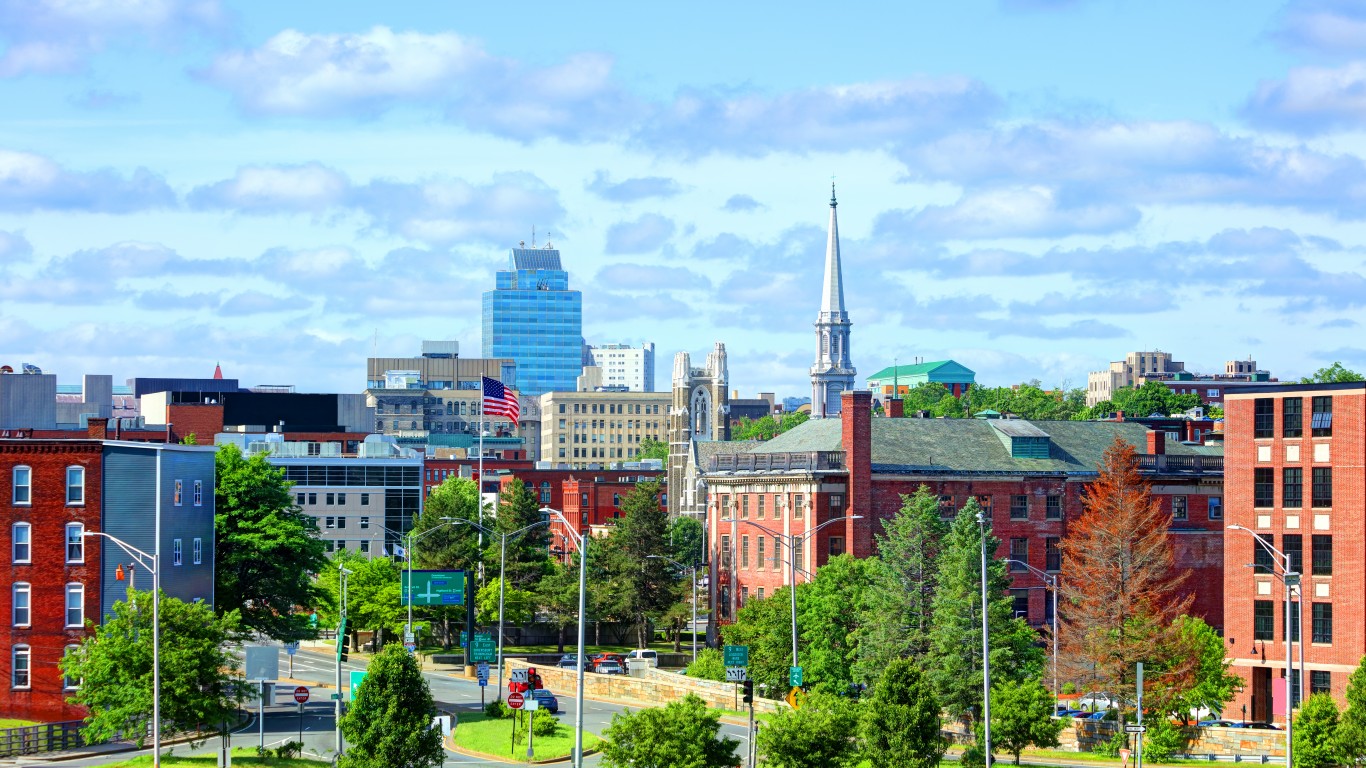
10. Hampden County

- Average popular vote split in last 4 presidential elections: 58.8% Democratic; 37.8% Republican
- Popular vote split in 2020 election: 57.0% Democrat (Joe Biden); 39.5% Republican (Donald Trump)
- Popular vote split in 2016 election: 55.4% Democrat (Hillary Clinton); 38.7% Republican (Donald Trump)
- Popular vote split in 2012 election: 61.7% Democrat (Barack Obama); 36.6% Republican (Mitt Romney)
- Popular vote split in 2008 election: 61.4% Democrat (Barack Obama); 36.1% Republican (John McCain)
- County population: 464,575
9. Essex County
- Average popular vote split in last 4 presidential elections: 59.6% Democratic; 37.3% Republican
- Popular vote split in 2020 election: 62.9% Democrat (Joe Biden); 34.1% Republican (Donald Trump)
- Popular vote split in 2016 election: 58.5% Democrat (Hillary Clinton); 35.9% Republican (Donald Trump)
- Popular vote split in 2012 election: 57.4% Democrat (Barack Obama); 41.1% Republican (Mitt Romney)
- Popular vote split in 2008 election: 59.1% Democrat (Barack Obama); 38.8% Republican (John McCain)
- County population: 806,103
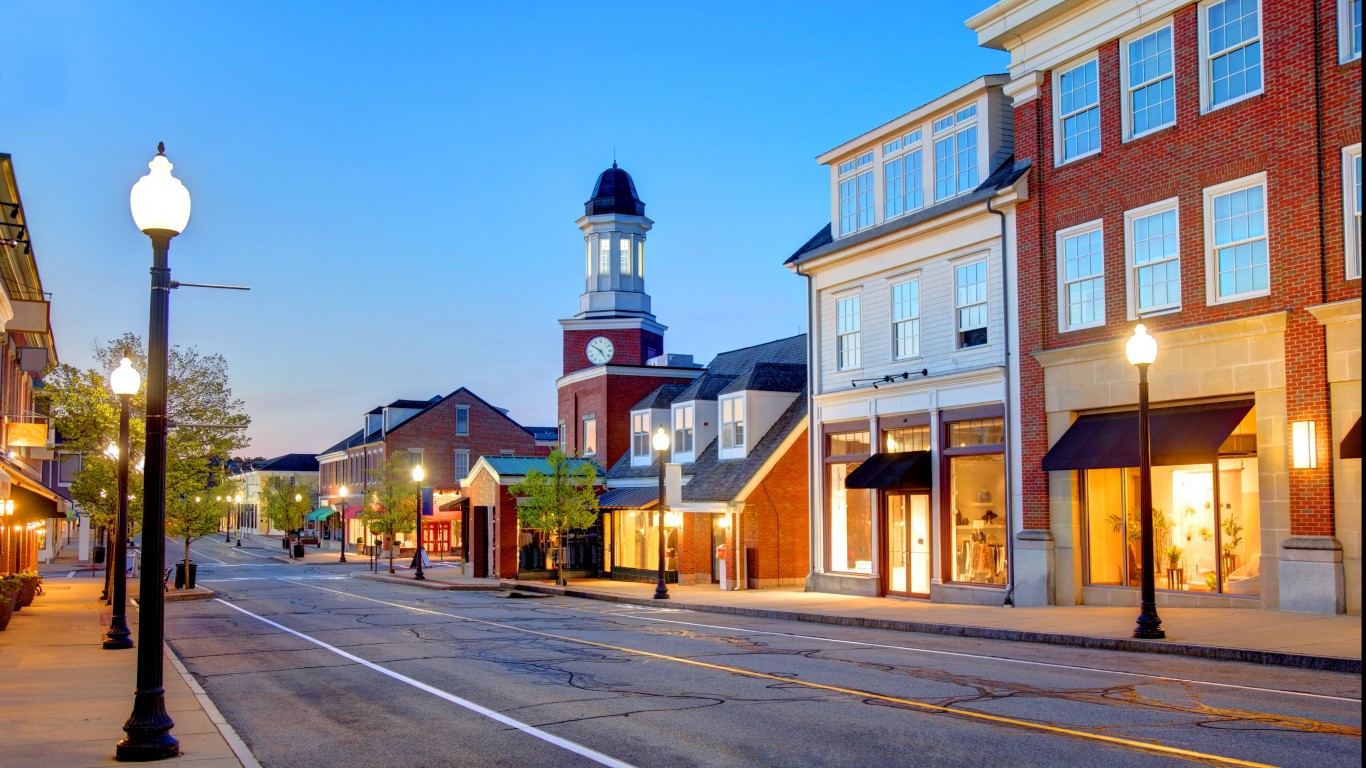
8. Norfolk County
- Average popular vote split in last 4 presidential elections: 61.0% Democratic; 36.0% Republican
- Popular vote split in 2020 election: 66.5% Democrat (Joe Biden); 30.5% Republican (Donald Trump)
- Popular vote split in 2016 election: 61.4% Democrat (Hillary Clinton); 33.1% Republican (Donald Trump)
- Popular vote split in 2012 election: 56.9% Democrat (Barack Obama); 41.6% Republican (Mitt Romney)
- Popular vote split in 2008 election: 58.2% Democrat (Barack Obama); 39.6% Republican (John McCain)
- County population: 722,112
7. Middlesex County
- Average popular vote split in last 4 presidential elections: 66.2% Democratic; 30.6% Republican
- Popular vote split in 2020 election: 71.0% Democrat (Joe Biden); 26.1% Republican (Donald Trump)
- Popular vote split in 2016 election: 66.4% Democrat (Hillary Clinton); 28.0% Republican (Donald Trump)
- Popular vote split in 2012 election: 62.6% Democrat (Barack Obama); 35.4% Republican (Mitt Romney)
- Popular vote split in 2008 election: 64.0% Democrat (Barack Obama); 33.9% Republican (John McCain)
- County population: 1,623,109
6. Nantucket County
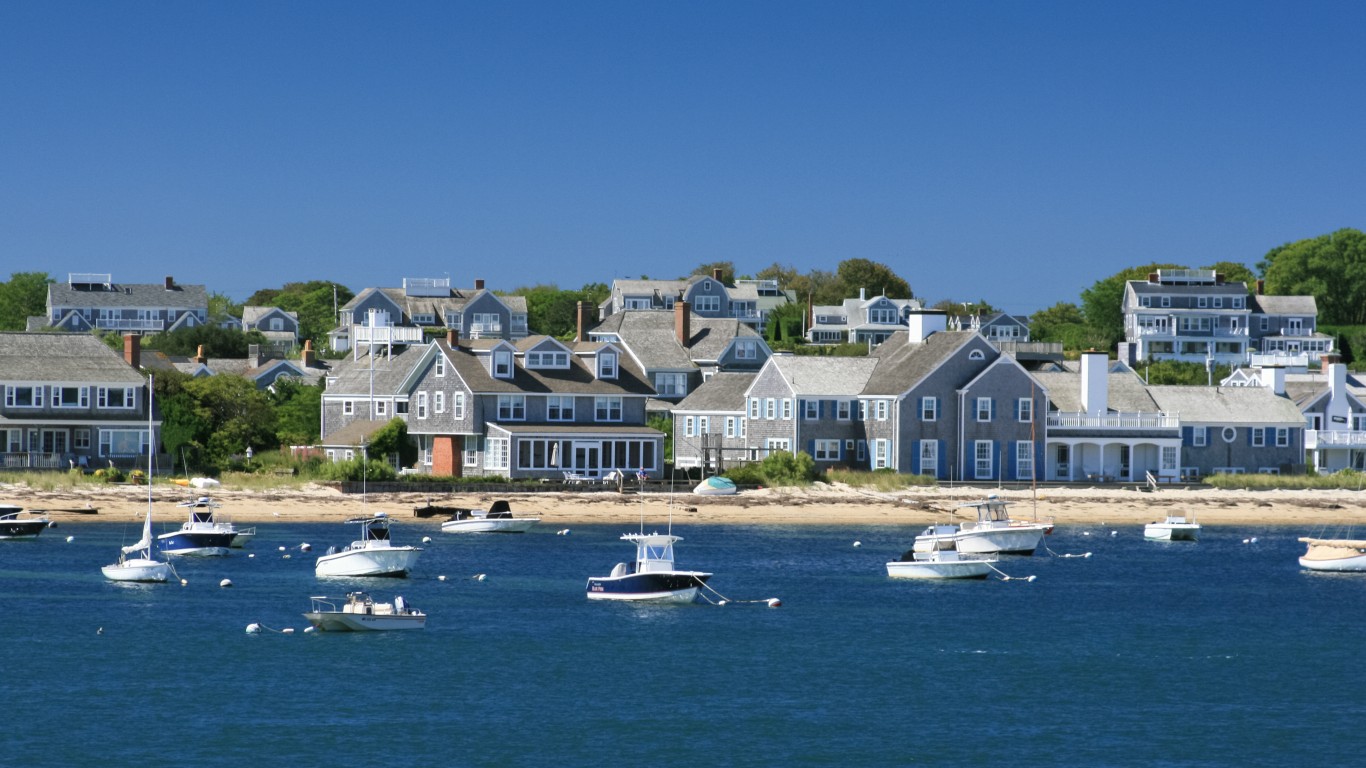
- Average popular vote split in last 4 presidential elections: 66.7% Democratic; 30.3% Republican
- Popular vote split in 2020 election: 71.4% Democrat (Joe Biden); 26.1% Republican (Donald Trump)
- Popular vote split in 2016 election: 64.7% Democrat (Hillary Clinton); 29.5% Republican (Donald Trump)
- Popular vote split in 2012 election: 62.6% Democrat (Barack Obama); 35.7% Republican (Mitt Romney)
- Popular vote split in 2008 election: 67.3% Democrat (Barack Obama); 30.8% Republican (John McCain)
- County population: 14,065
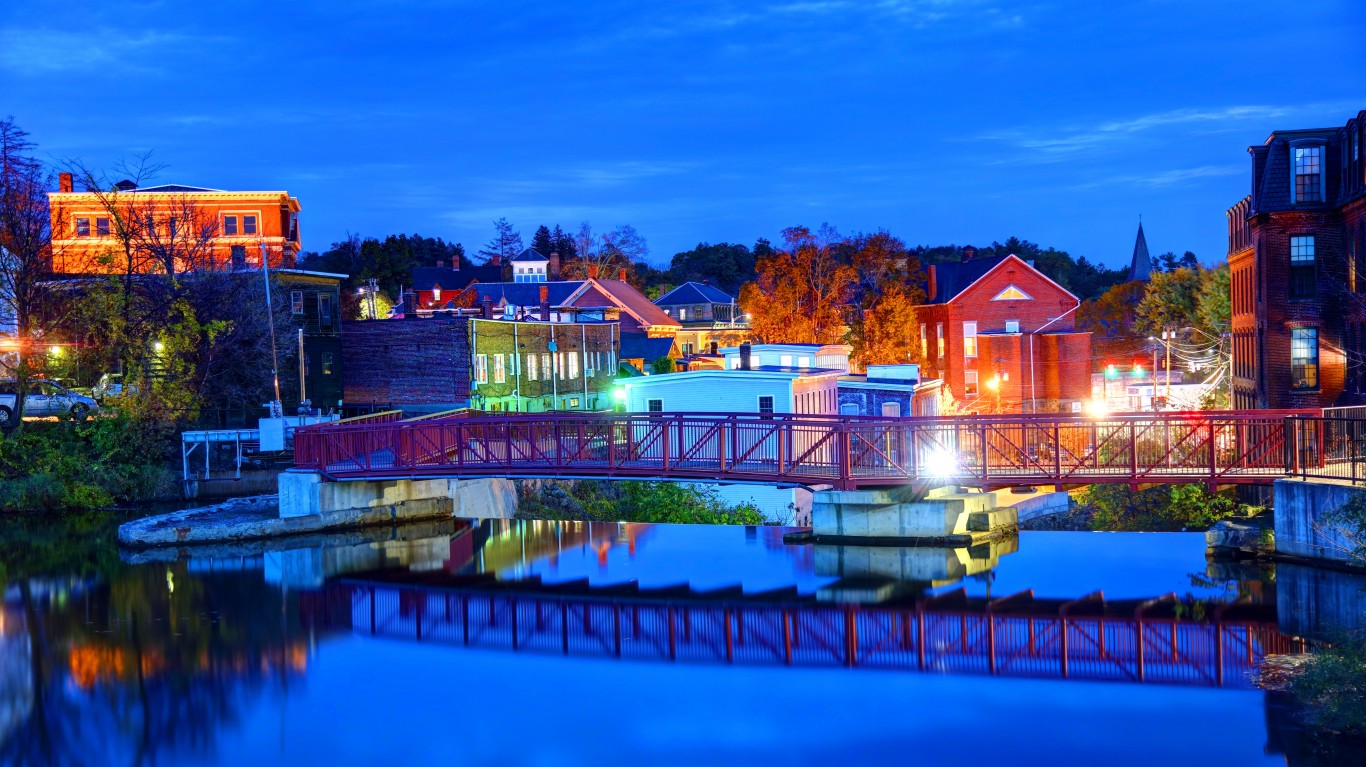
5. Franklin County
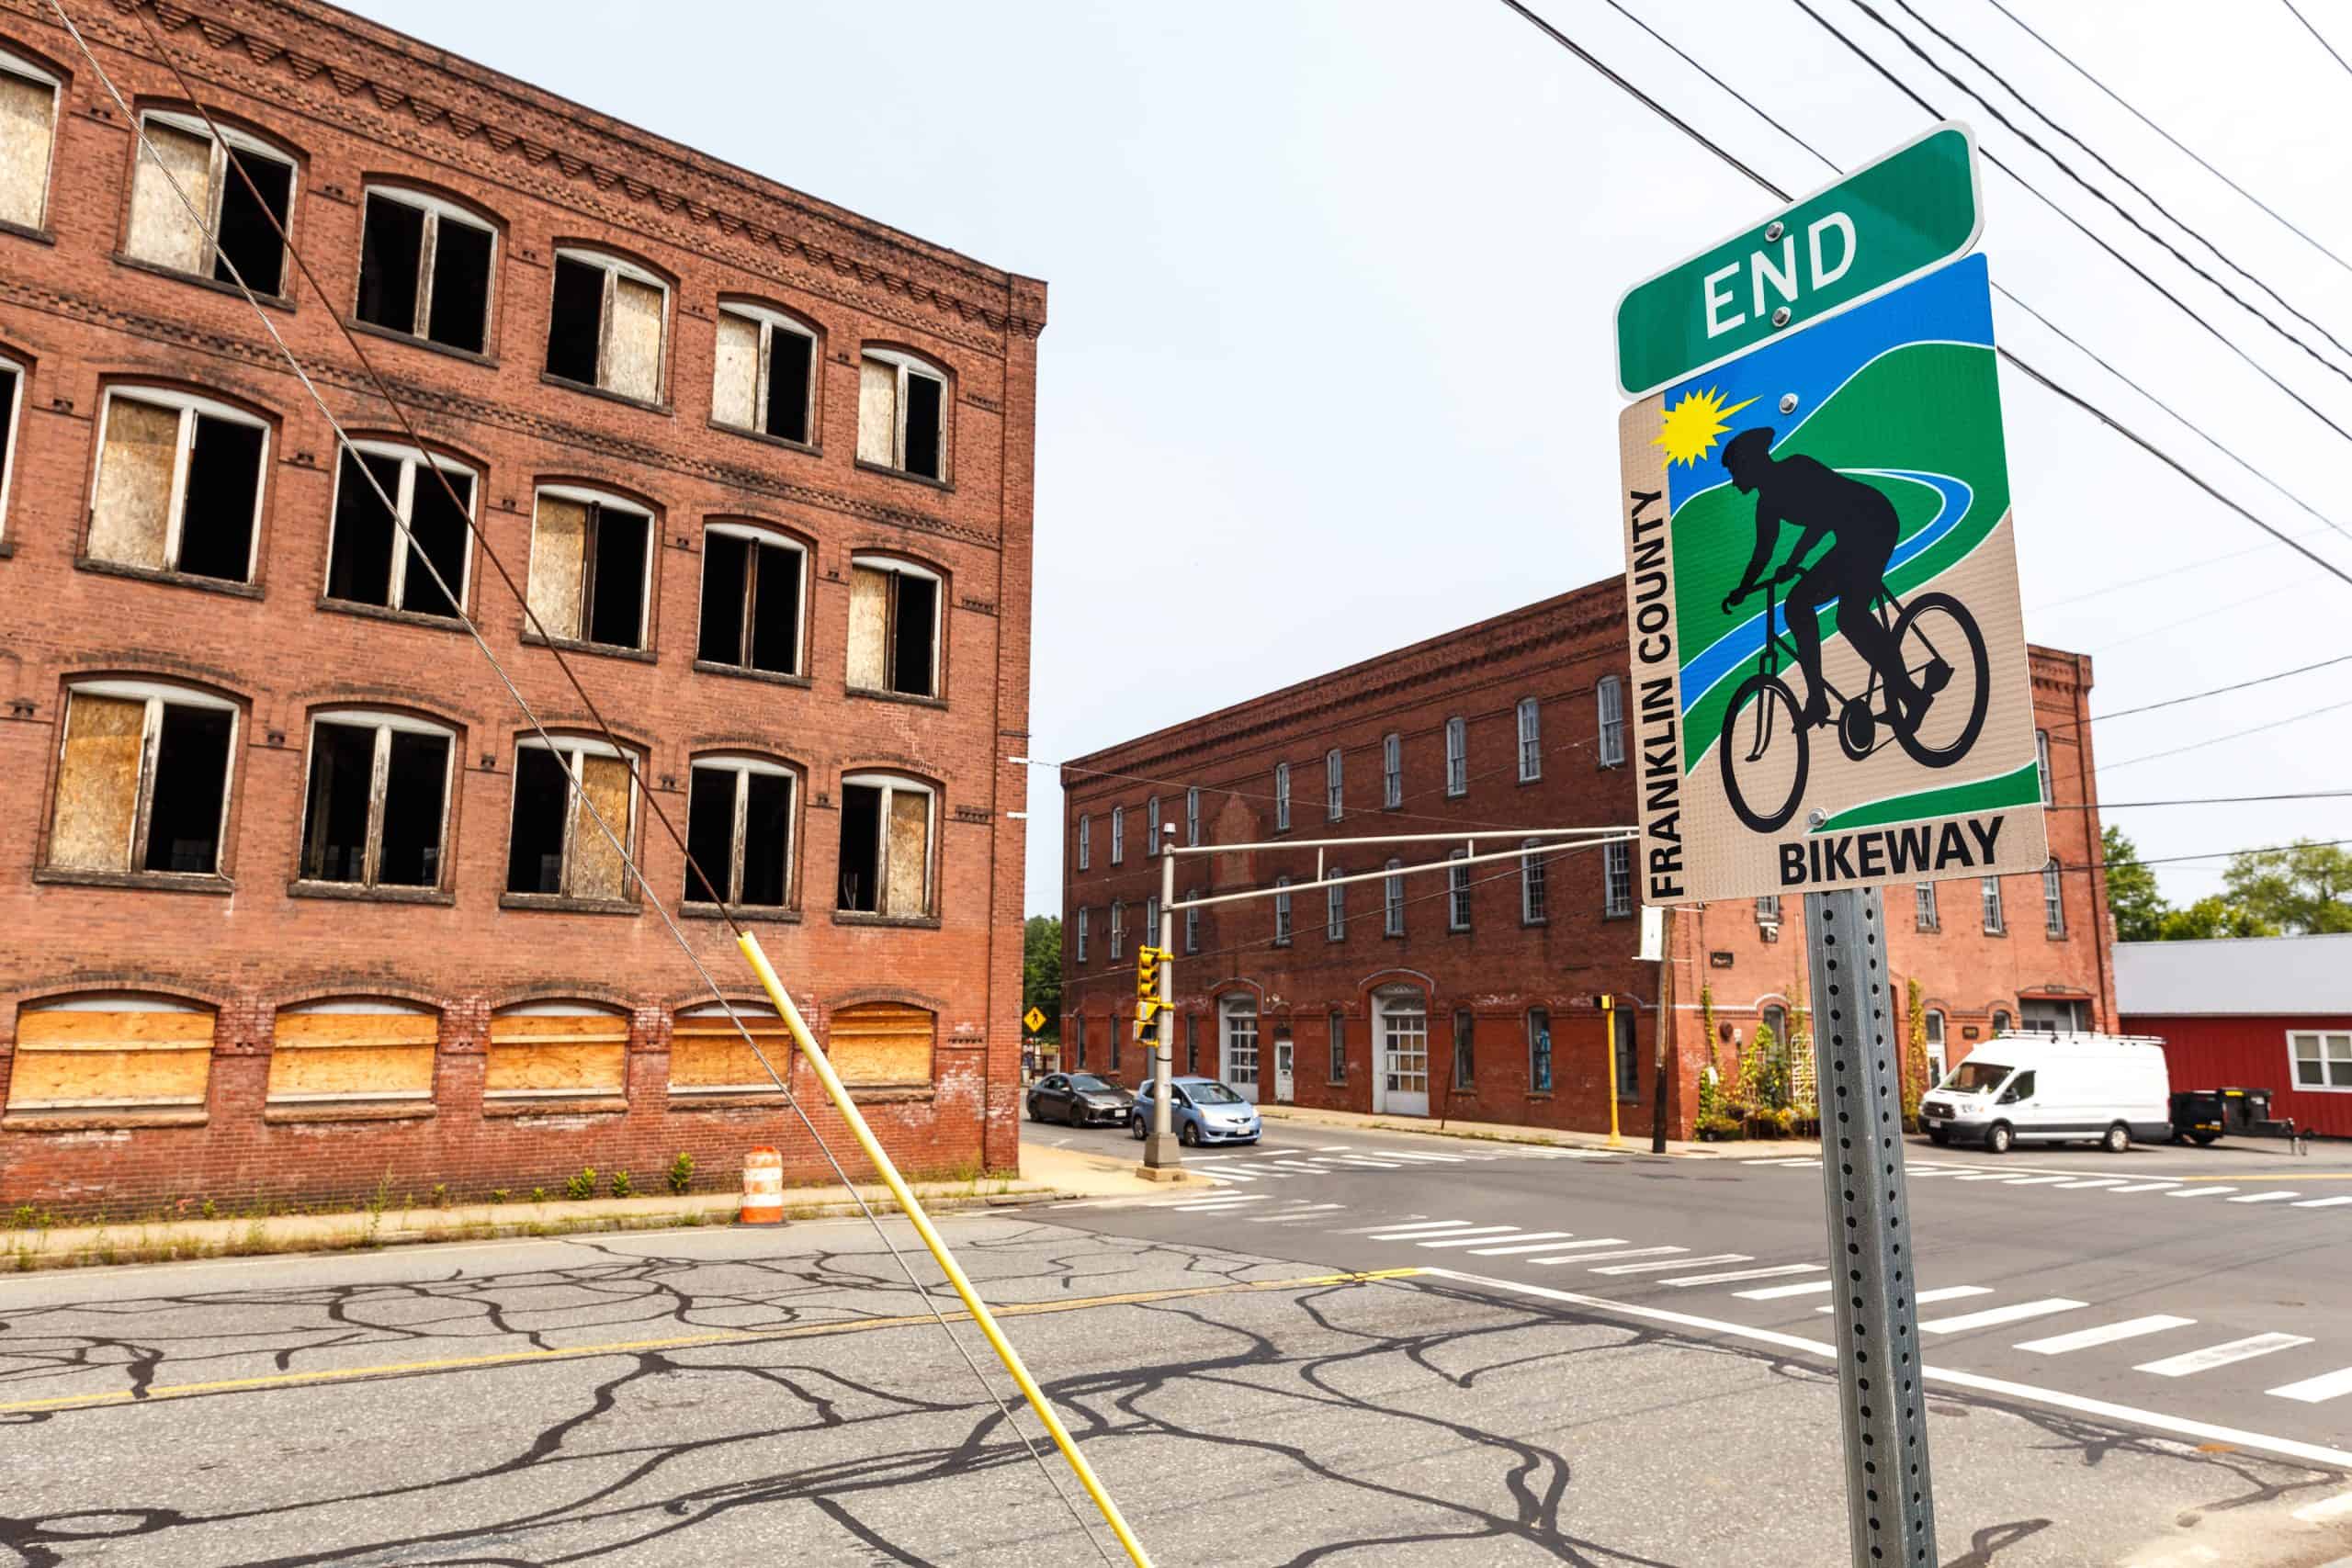
- Average popular vote split in last 4 presidential elections: 69.5% Democratic; 25.7% Republican
- Popular vote split in 2020 election: 69.8% Democrat (Joe Biden); 26.0% Republican (Donald Trump)
- Popular vote split in 2016 election: 64.1% Democrat (Hillary Clinton); 27.1% Republican (Donald Trump)
- Popular vote split in 2012 election: 71.7% Democrat (Barack Obama); 24.7% Republican (Mitt Romney)
- Popular vote split in 2008 election: 72.4% Democrat (Barack Obama); 24.8% Republican (John McCain)
- County population: 70,980
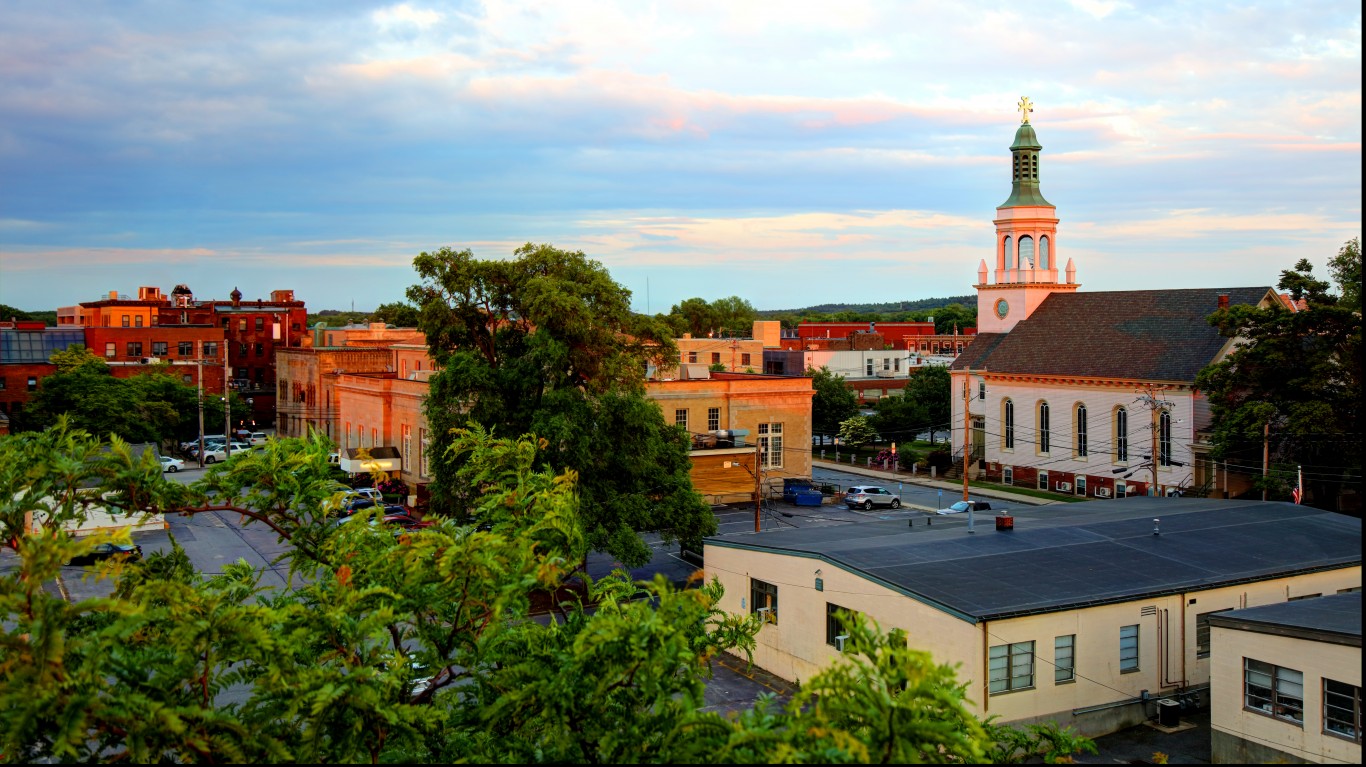
4. Hampshire County
- Average popular vote split in last 4 presidential elections: 70.1% Democratic; 25.9% Republican
- Popular vote split in 2020 election: 71.7% Democrat (Joe Biden); 25.2% Republican (Donald Trump)
- Popular vote split in 2016 election: 66.7% Democrat (Hillary Clinton); 26.3% Republican (Donald Trump)
- Popular vote split in 2012 election: 70.3% Democrat (Barack Obama); 26.3% Republican (Mitt Romney)
- Popular vote split in 2008 election: 71.5% Democrat (Barack Obama); 25.9% Republican (John McCain)
- County population: 153,931
3. Berkshire County
- Average popular vote split in last 4 presidential elections: 72.5% Democratic; 24.0% Republican
- Popular vote split in 2020 election: 72.0% Democrat (Joe Biden); 25.2% Republican (Donald Trump)
- Popular vote split in 2016 election: 67.5% Democrat (Hillary Clinton); 26.0% Republican (Donald Trump)
- Popular vote split in 2012 election: 75.7% Democrat (Barack Obama); 22.1% Republican (Mitt Romney)
- Popular vote split in 2008 election: 74.9% Democrat (Barack Obama); 22.5% Republican (John McCain)
- County population: 128,763
2. Dukes County
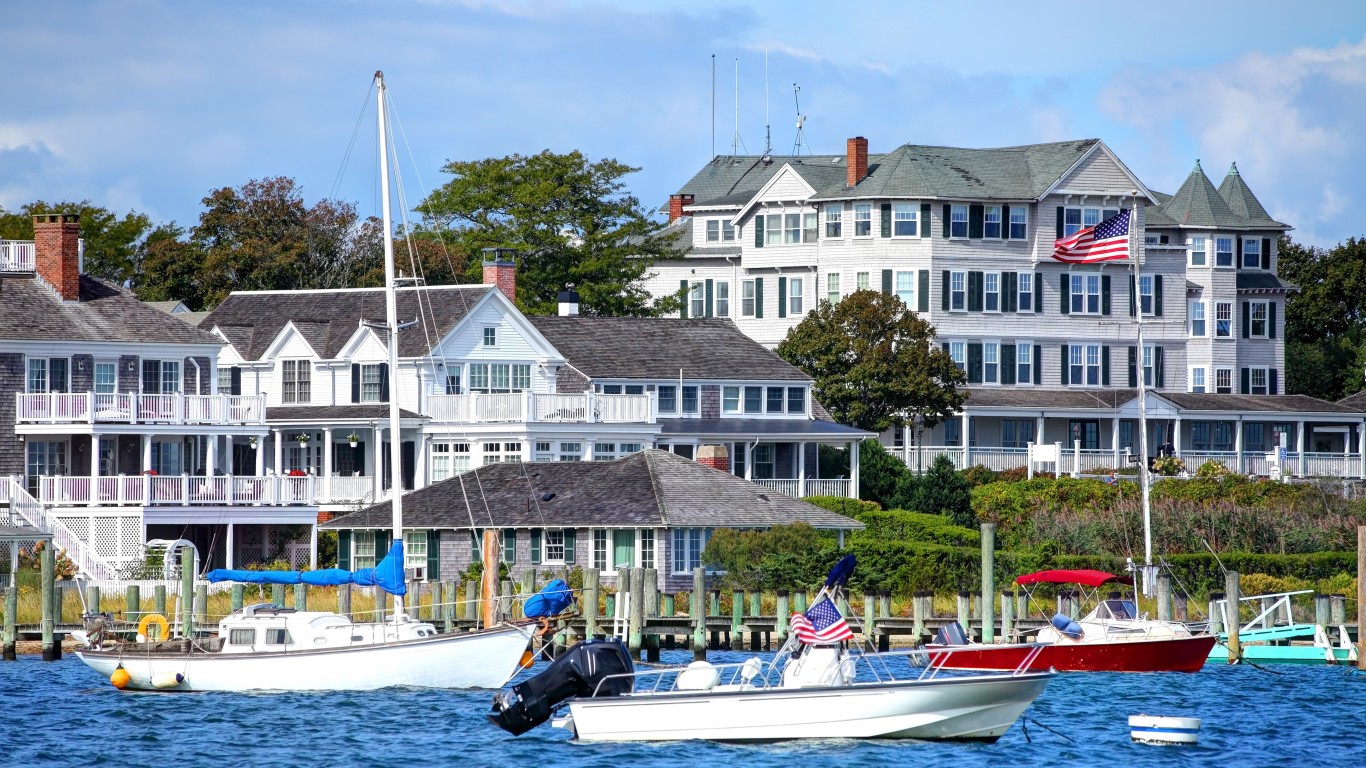
- Average popular vote split in last 4 presidential elections: 74.5% Democratic; 22.5% Republican
- Popular vote split in 2020 election: 77.0% Democrat (Joe Biden); 20.4% Republican (Donald Trump)
- Popular vote split in 2016 election: 73.0% Democrat (Hillary Clinton); 21.5% Republican (Donald Trump)
- Popular vote split in 2012 election: 72.7% Democrat (Barack Obama); 25.5% Republican (Mitt Romney)
- Popular vote split in 2008 election: 75.0% Democrat (Barack Obama); 23.1% Republican (John McCain)
- County population: 20,543
1. Suffolk County
- Average popular vote split in last 4 presidential elections: 78.7% Democratic; 18.8% Republican
- Popular vote split in 2020 election: 80.2% Democrat (Joe Biden); 17.4% Republican (Donald Trump)
- Popular vote split in 2016 election: 79.6% Democrat (Hillary Clinton); 16.3% Republican (Donald Trump)
- Popular vote split in 2012 election: 77.4% Democrat (Barack Obama); 20.8% Republican (Mitt Romney)
- Popular vote split in 2008 election: 76.9% Democrat (Barack Obama); 21.2% Republican (John McCain)
- County population: 785,443