With the stock market close to all-time highs, some investors are wondering whether they should lock in their gains or step into some aspects of the market that have not caught up yet with the broader market performance. It is no secret that some sectors have companies that largely move in tandem, and the airline industry usually fits that bill, barring any major accidents or other company-specific drags.
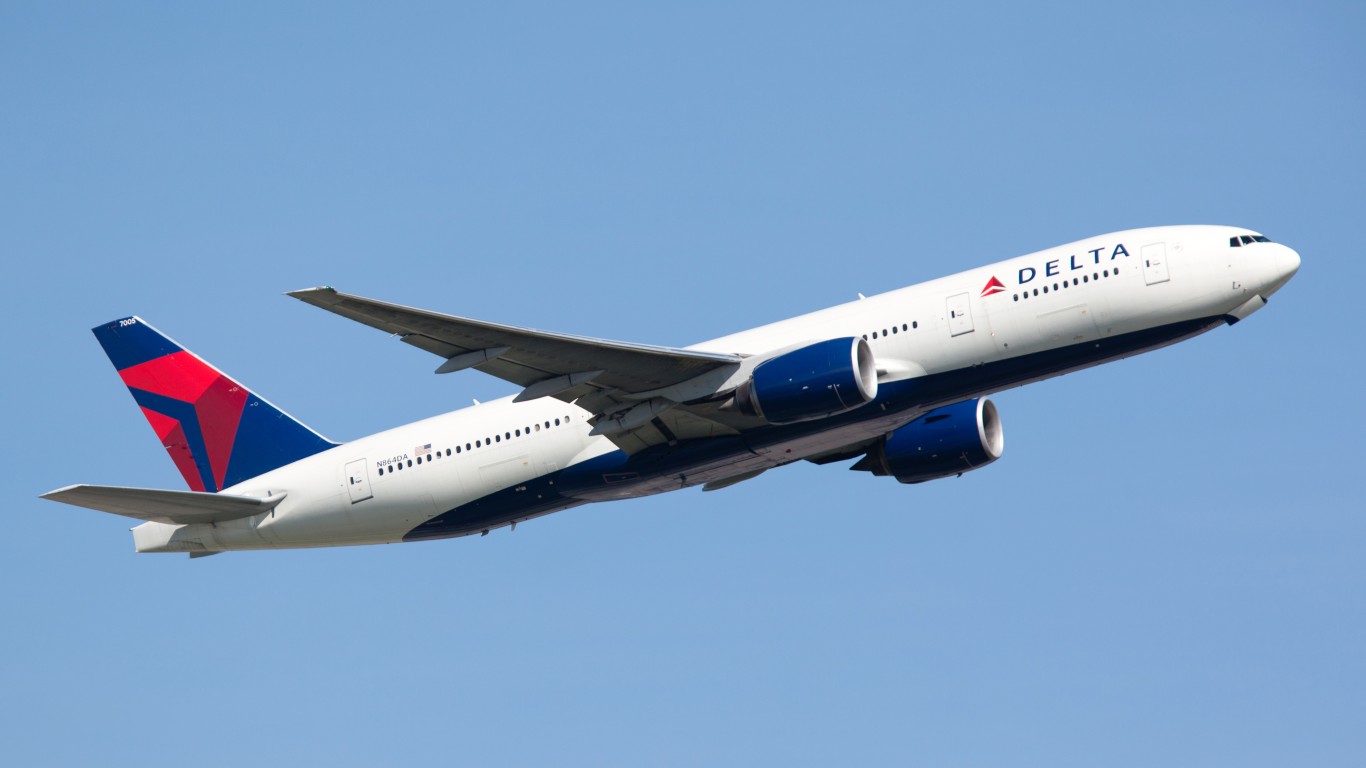
Now that Delta Air Lines Inc. (NYSE: DAL | DAL Price Prediction) has told investors that it would come in at the higher end of its prior guidance, there was some renewed excitement in airlines. While the Dow Jones industrials and S&P 500 hit all-time highs in the past week, Delta’s shares are within about 3% of its all-time high. If Delta breaks out to new highs after this week’s earnings, that could lift all airline stocks higher. That said, an “if” is far from a certainty.
Delta generates a current dividend yield of 2.35%, which is higher than the 10-year Treasury note and is actually the highest dividend yield of all major airlines today. It is also the largest of the air carriers by market cap. Its shares were last seen up almost 18% year to date. On top of recently issuing guidance, Delta is set to release its most quarterly earnings results first thing on Thursday, July 11, 2019. The consensus forecast from Refinitiv calls for $2.24 in earnings per share and $12.46 billion in revenue for the second quarter.
Delta recently noted that it sees revenue per available seat mile up 1.5% to 3.5% in the second quarter, and the company has increased its capacity by a greater than expected 4%, for total revenue growth of 8.0% to 8.5%. Its adjusted unit costs, excluding fuel, are said to remain on track for a 1% to 2% gain, and Delta’s per-gallon fuel cost was put in a range of $2.07 to $2.12, compared with a prior range of $2.10 to $2.20.
It’s time to move past raw fundamentals. What will matter in an industry-lifting event, assuming Delta is successful, is that it could pull up the other major American air carriers in a technical breakout. Some technical investors care about fundamentals, but many fundamental investors greatly care about technical analysis. After all, most investors know better than to buy stocks that are falling in a strong market. If there are hundreds of winners in the market, why bother chasing the losers? Still, many investors might be looking for a catch-up trade here, particularly given the relationship between the market as a whole and transportation stocks.
While the rule of following leaders may seem obvious, getting into those companies that just haven’t caught up yet and may surge even more on a catch-up trade can be where real money is made after a rally. If a stock is performing poorly in a major bull market, ask yourself how bad it might be doing if the market was headed down.
Shares of Delta were trading at $59.30 on Monday, in a 52-week range of $45.08 to $61.32 and with a Refinitiv consensus analyst target price of $67.22. What matters here is that Delta is the leader with a $38.8 billion market cap. It is also valued at 8.6 times the current Refinitiv consensus analyst earnings estimate for this year.
The relative airline data has been broken down into legacy and largest carriers first, with regional players after.
American Airlines Group Inc. (NASDAQ: AAL) was trading at $32.61, with a market cap of $14.5 billion. It is valued at less than six times expected earnings per share and is up only about 1% year to date. American Airlines has a 52-week range of $27.02 to $43.89 and a consensus target price of $40.56. It has a dividend yield of 1.2%.
[recirclink id=558697]
Southwest Airlines Co. (NYSE: LUV) was trading at $51.84, and it has the largest market cap in the air carrier segment at $28 billion. It is valued at nearly 10 times expected earnings per share and was last seen up about 12% so far in 2019. Southwest Airlines has a 52-week range of $44.28 to $64.02 and a consensus target price of $59.18. The dividend yield is 1.4%.
United Continental Holdings Inc. (NYSE: UAL) traded at $90.60. Its market cap is almost $24 billion, and it is valued at about eight times expected earnings per share. United Continental has a 52-week range of $67.94 to $97.85 and a consensus target price of $104.65. Its shares were up only about 8% so far in 2019.
Alaska Air Group Inc. (NYSE: ALK) traded at $64.40 with a market cap of $7.9 billion. It is valued at 11 times forward earnings. Alaska Airlines has an almost 2.2% dividend yield that rivals Delta, and its 52-week range is $53.39 to $74.83. The consensus target price is $73.67. The stock was up just over 5% so far in 2019.
JetBlue Airways Corp. (NASDAQ: JBLU) was trading at $19.37, with a market cap of $5.9 billion, and it is valued at just over eight times expected earnings. JetBlue has a 52-week range of $15.19 to $20.14. The consensus target price is $20.44, and the shares are up almost 20% so far this year.
Spirit Airlines Inc. (NYSE: SAVE) is the most recent of the true discount airlines, and at $51.25 a share, it has a market cap of $3.5 billion. It is still valued at about eight times expected earnings, despite growing faster than most carriers. Spirit Airlines has a 52-week trading range of $35.66 to $65.35 and a consensus target price of $67.13. While most airlines are up in 2019, Spirit is still down about 12%.
SkyWest Inc. (NASDAQ: SKYW) may be the regional player with smaller planes, but it operates flights as Delta Connection, United Express, American Eagle or Alaska under code-sharing arrangements. It was also the top performing airline stock, with a 40% gain so far in 2019. At $62.10 a share, it has a market cap of $3.3 billion and is valued at just over nine times expected earnings. SkyWest has a 52-week range of $42.38 to $65.80 and a consensus target price of $71.63. The dividend yield is 0.8%.
[recirclink id=558697]
24/7 Wall St. has included a one-year StockCharts.com snapshot of each of the domestic airline stocks. Delta and SkyWest seem to be the two closest to breakout patterns, but none of these airlines have stock charts that are screaming terrible trouble and danger based on the known information today.

[wallst_email_signup]