Shares of Costco Wholesale Corporation (NASDAQ: COST | COST Price Prediction) lost 2.12% over the past month after losing 4.77% the month prior. Since its one-year high on Feb. 13, the stock is down 18.68%. COST continues to pay shareholders a dividend that yields 0.59%, or $1.29 per share quarterly.
When Costco reported its FY 2026 Q1 earnings on Dec. 11, 2025, it beat on the top and bottom lines. The company reported earnings per share of $4.50 versus $4.31 expected and revenue of $67.31 billion versus $67.14 billion expected.
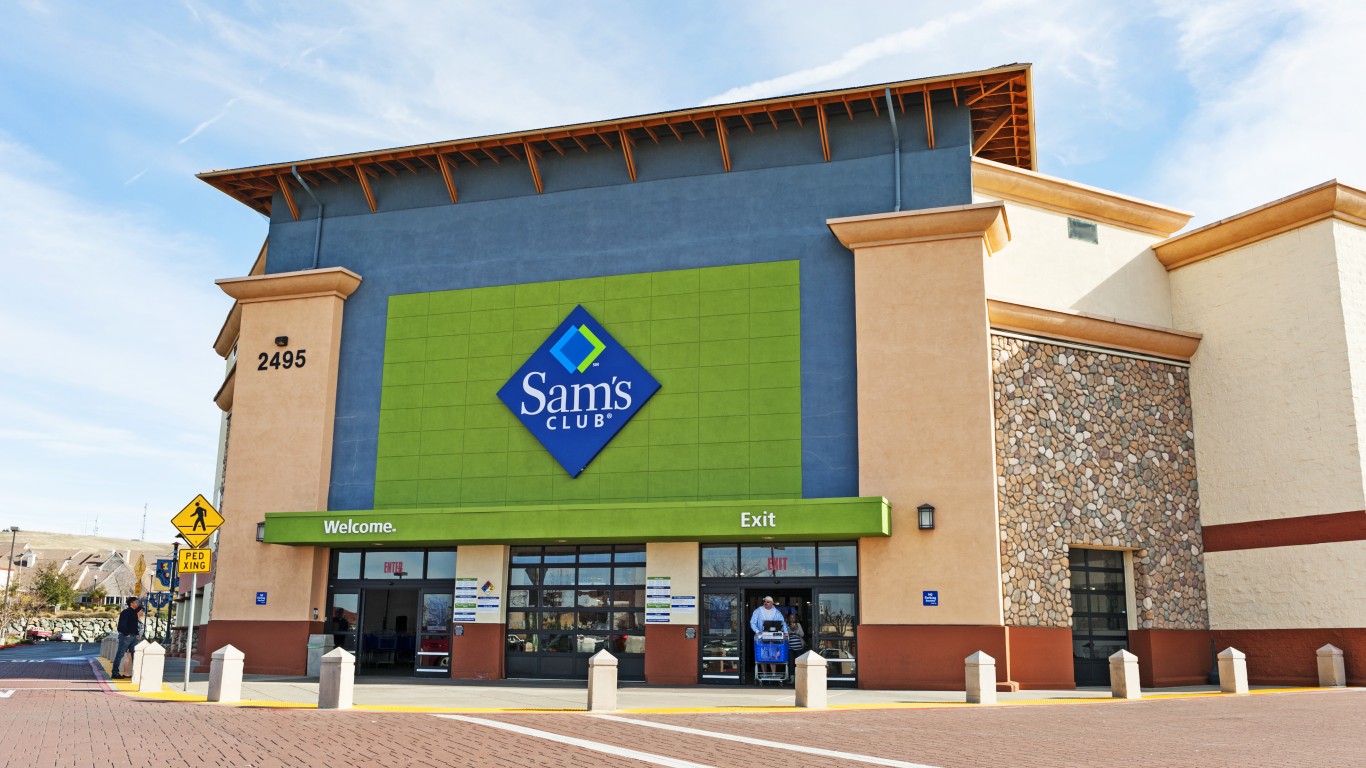
The warehouse retail club, headquartered in Issaquah, Wash., sells high volumes of foods and general merchandise at discounted prices through membership warehouses. With 923 locations worldwide and 633 locations in the U.S., it is the largest warehouse club, ahead of rivals Sam’s Club, Wholesale Club and BJ’s, and boasts nearly 145 million members. Costco’s volume discount warehouse pricing model has been a life preserver for many families pooling resources to buy in bulk and divide afterwards. This has been a key driver of recent growth. Nevertheless, investors are much more concerned with future stock performance over the next one, five and 10 years.
While most Wall Street analysts will calculate 12-month forward projections, it’s clear that nobody has a consistent crystal ball, and plenty of unforeseen circumstances can render even near term projections irrelevant. 24/7 Wall St. aims to present some farther looking insights based on Costco’s own numbers, along with business and market development information that may be of help to our readers’ own research.
Costco (COST) Recent Stock Success Past Performance
Worldwide, Costco memberships have consistently renewed at 90%. In the past 10 years, the store count expanded at a compound annual rate of 3% as management opened 23 net new locations in fiscal 2023 and 31 new locations in 2024.
| Fiscal Year | Price | Total Revenues* | Net Income* |
| 2014 | $121.08 | $112.6 | $2.05 |
| 2015 | $140.05 | $116.1 | $2.37 |
| 2016 | $162.09 | $118.7 | $2.35 |
| 2017 | $156.74 | $129.0 | $2.67 |
| 2018 | $233.13 | $141.5 | $3.13 |
| 2019 | $294.76 | $152.7 | $3.65 |
| 2020 | $347.66 | $166.7 | $4.00 |
| 2021 | $455.49 | $195.9 | $5.00 |
| 2022 | $522.10 | $226.9 | $5.84 |
| 2023 | $549.28 | $242.3 | $6.29 |
| 2024 | $892.38 | $254.5 | $7.37 |
*Total Revenues and Net Income in $billions
Key Drivers of Costco’s Stock Performance
1. ‘If It Ain’t Broken’: It’s reasonable to expect Costco to continue growing its revenue and earnings within its 10-year mean range. Costco’s massive scale makes the threat of disruption minimal. Similar to Walmart, It’s hard for smaller chains to compete with Costco’s ability to obtain optimum discount pricing from its suppliers.
2. Durability: Costco’s durability is fueled by its loyal membership base. Memberships carry a 90% renewal rate worldwide, driving repeat purchase behavior. As long as management doesn’t rock the boat with its policy of putting the customer first, Costco will maintain its industry standing.
3. Emerging AI Focus and Expanding Business Lines: A.I. and e-commerce will become key components of Costco’s international expansion strategy. Additionally, broadened international relationships should open the doors for more localized supply chain opportunities. This will help to maintain margins and reduce shipping and other costs to international outlets and their customers.
Costco (COST) Headwinds and Challenges
- Another wave of inflation from Fed Funds rate cuts could completely sink the pooling option for those households already barely hanging on. The result would be canceled memberships, which comprise nearly half of Costco revenues.
- The late investment guru Charlie Munger was a big Costco fan, but cautioned that the stock would become problematic if its P/E ratio exceeded 40. It is currently 55.
- Rivals like Sam’s Club have announced the launch of new strategic initiatives to better compete with Costco in the upcoming future.
Costco (COST) Price Prediction for 2026
The median one-year price target from Wall Street analysts is $1046.69, which represents 19.52% potential upside from today’s share price. Based on 23 analysts covering Costco, the stock receives a consensus “Moderate Buy” rating, with 17 analysts assigning it as a “Buy,” six assigning it as a “Hold” and one assigning it as a “Sell.”
However, 24/7 Wall St.’s year-end price target for Costco is $1,013.41, or 15.72% potential upside from today’s price. Our assumption is based on an EPS of $17.80 and a P/E ratio of 51.
Costco (COST) Stock Price Target 2026–2030
While Costco’s expansion to new countries will launch, local assimilation success will vary depending on regional culture, tastes and practices. As customer service is a major part of Costco’s member loyalty, the etiquette required for each location will not be a cookie cutter winner across the board. Not unlike Walmart’s growing pains in its China venture, Costco will experience its own challenges. Additionally, Costco’s investment in automated warehouse technologies should continue to improve efficiency and reduce costs. The company’s e-commerce segment should continue to show solid year-over-year growth and take a big leap forward by the end of the decade, thanks to AI.
Greater individualized customization of the purchasing experience in different nations and regions should finally become manifest. Additional enhancements in cold storage and last-mile delivery solutions for maintaining grocery produce freshness should be a winner with customers around the globe. However, this may be offset by potentially higher domestic expenses, due to food supply conflicts between farmers and distributors, like Tyson Foods, as well as the USDA.
By the conclusion of 2030, 24/7 Wall St. estimates that Costco’s stock will be trading for $1,599.54, equating to an 82.65% gain from the current share price. That calculation is based on an EPS of $27.70 and a P/E ratio of 37.
| Year | P/E Ratio | EPS | Price | %Change From Current Price |
| 2026 | 45 | $19.61 | $1,123.79 | 15.72% |
| 2027 | 41 | $21.85 | $1,240.64 | 41.66% |
| 2028 | 37 | $25.54 | $1,292.11 | 47.54% |
| 2029 | 37 | $25.53 | $1,375.11 | 57.02% |
| 2030 | 37 | $27.70 | $1,599.54 | 82.65% |