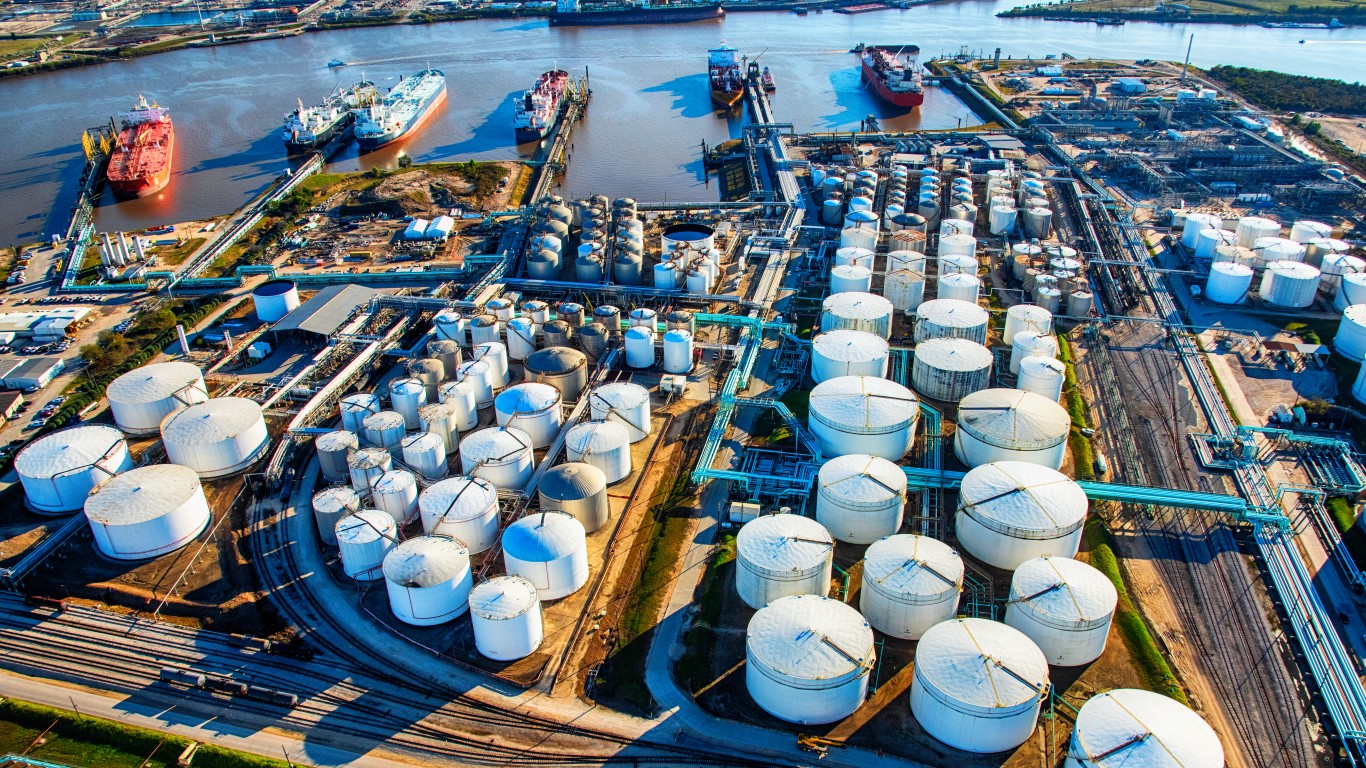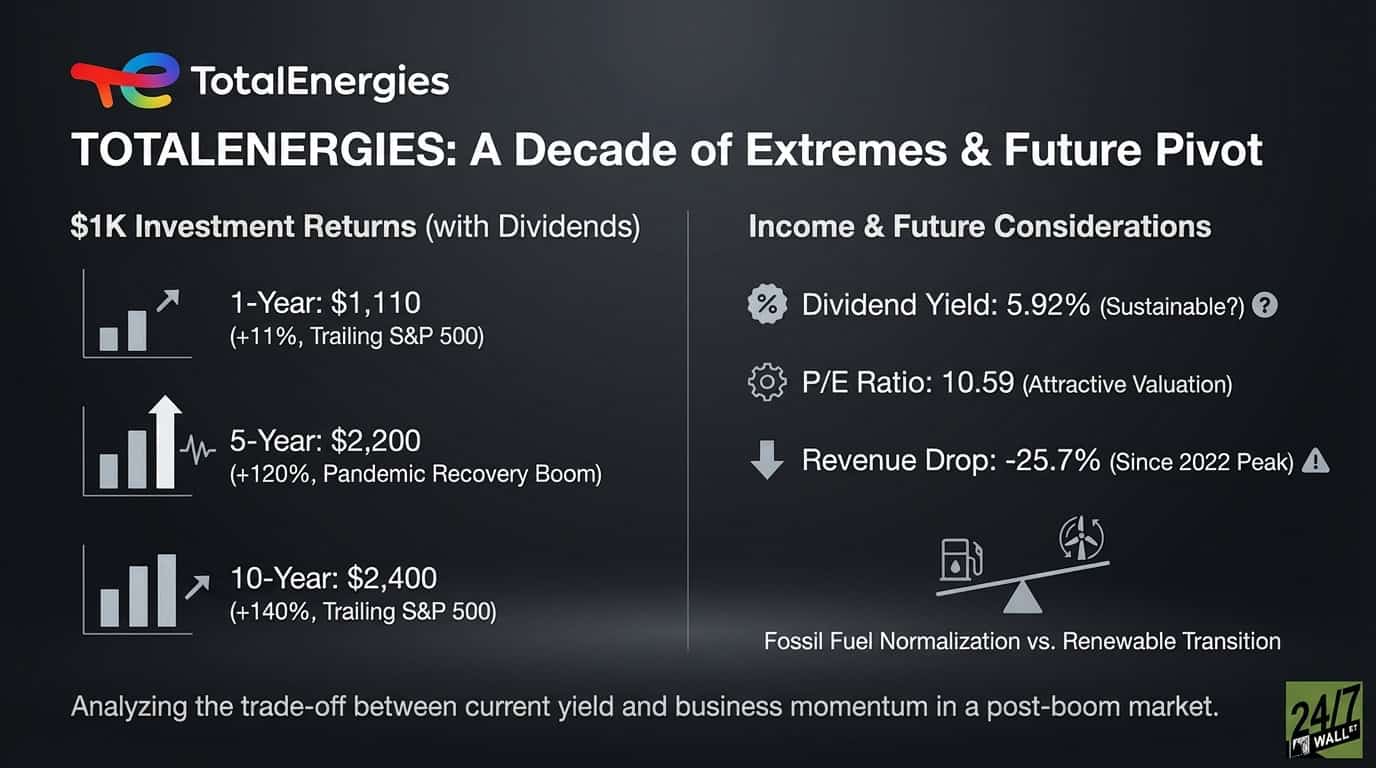
TotalEnergies (NYSE: TTE | TTE Price Prediction) has delivered a story of extremes over the past decade. The French energy giant navigated a devastating pandemic crash, rode the 2022 energy crisis to record profits, and now finds itself in a post-boom cooldown while attempting a gradual pivot toward renewable energy. For dividend investors, the question is whether that 5.92% yield remains sustainable as fossil fuel markets normalize.
From Crisis to Boom and Back Again
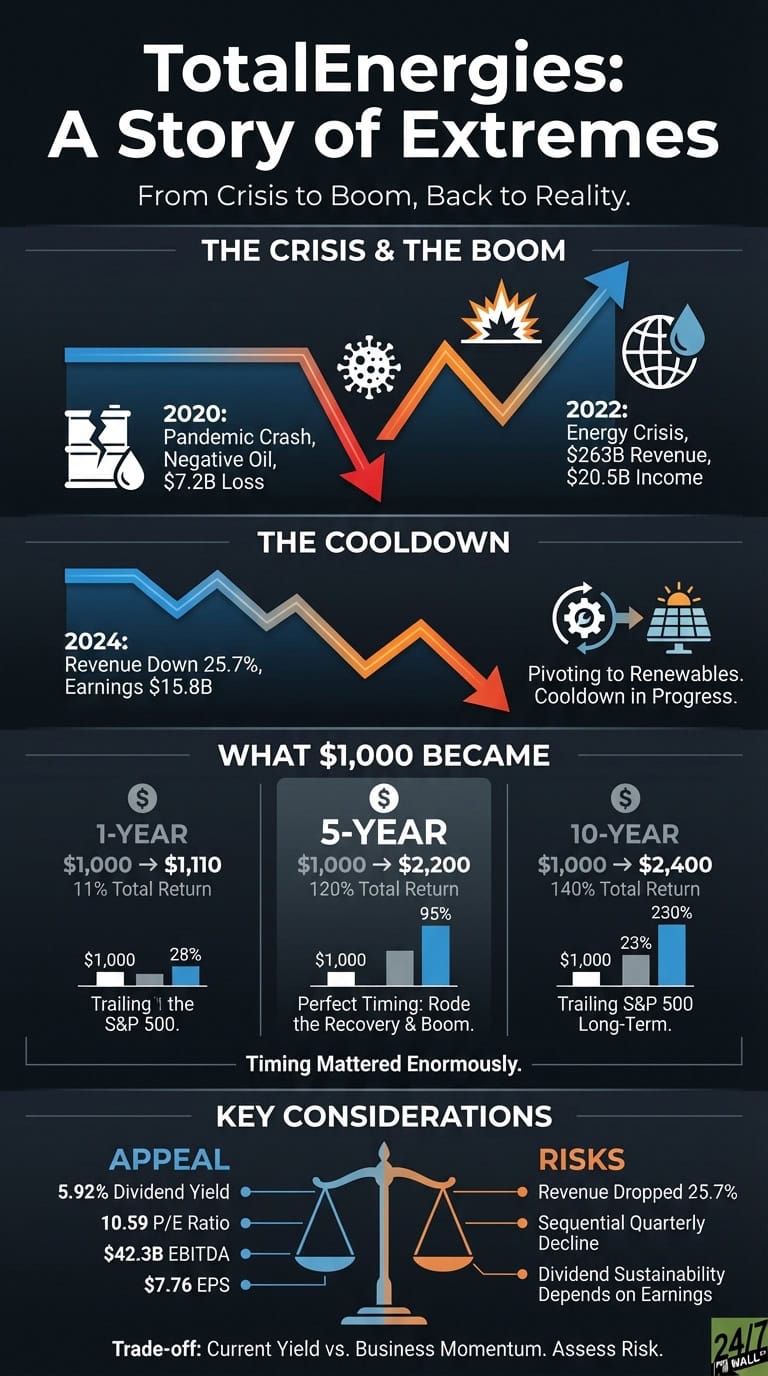
The past ten years split into distinct chapters for TotalEnergies. The company entered 2015 as a traditional oil and gas supermajor, generating steady cash flow from integrated operations. Then 2020 arrived. The pandemic crushed energy demand, and TotalEnergies posted a $7.2 billion loss as oil prices briefly went negative.
The recovery proved explosive. Revenue surged to $263 billion in 2022 during the energy crisis triggered by Russia’s invasion of Ukraine. Net income hit $20.5 billion. But that peak didn’t last. By 2024, revenue had fallen 25.7% to $196 billion, and earnings dropped to $15.8 billion. The company now trades near its 52-week high of $66.92, but underlying business momentum has clearly shifted.
What $1,000 Became
Here’s how a $1,000 investment performed across different time horizons, including dividend reinvestment:
1-Year Return
- Initial Investment: $1,000
- Current Value: $1,110
- Total Return: 11%
- S&P 500 (same period): Approximately 28%
5-Year Return
- Initial Investment: $1,000
- Current Value: $2,200
- Total Return: 120%
- Annualized Return: 17%
- S&P 500 (same period): Approximately 95%
10-Year Return
- Initial Investment: $1,000
- Current Value: $2,400
- Total Return: 140%
- Annualized Return: 9.1%
- S&P 500 (same period): Approximately 230%
The five-year window captured the pandemic recovery perfectly, turning $1,000 into $2,200 as TotalEnergies rebounded from 2020 lows and rode the energy boom. Dividends accounted for roughly half that return, paying out consistently even during the downturn. The ten-year story looks less impressive, with TotalEnergies trailing the S&P 500 significantly as tech stocks dominated market returns.
Timing mattered enormously. Investors who bought during the 2020 panic saw spectacular gains. Those who entered near the 2022 peak have essentially broken even on price appreciation, relying entirely on the 5.92% dividend to generate returns.
Key Considerations for Income Investors
The 10.59 P/E ratio and 5.92% yield appeal to income-focused portfolios, supported by $42.3 billion in EBITDA. The company earned $7.76 per share in 2024 while paying out $3.68 in dividends, a 47% payout ratio.
However, revenue has dropped 25.7% since 2022, and quarterly results show sequential decline through 2025. The sustainability of the dividend depends on whether earnings stabilize above $6 per share. Energy price trends and the success of the renewable transition will likely determine future cash flow generation.
This presents a trade-off between current yield and business momentum that income investors will need to evaluate based on their own risk tolerance and portfolio objectives.