This 9.7% Yield ETF Pays Triple VYM, But There’s a Hidden Problem

Photo of Michael Williams
By Michael Williams Published

Quick Read

  • SDIV’s 9.7% yield relies on mortgage REITs with payout ratios exceeding 200% and monthly dividends that have dropped 25% since early 2023.

  • Top holdings like AGNC and IVR distribute multiples of their earnings. This practice cannot continue indefinitely.

  • JEPI offers an 8.2% yield through covered calls on quality U.S. stocks with sustainable payout ratios like Broadcom’s 61%.

This post may contain links from our sponsors and affiliates, and Flywheel Publishing may receive compensation for actions taken through them.
This 9.7% Yield ETF Pays Triple VYM, But There’s a Hidden Problem

© 24/7 Wall St.

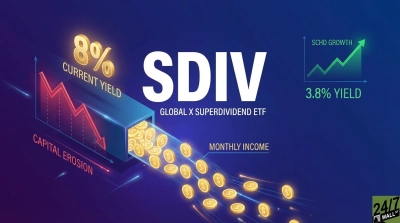
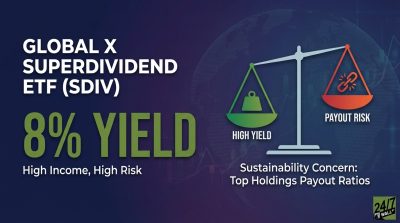
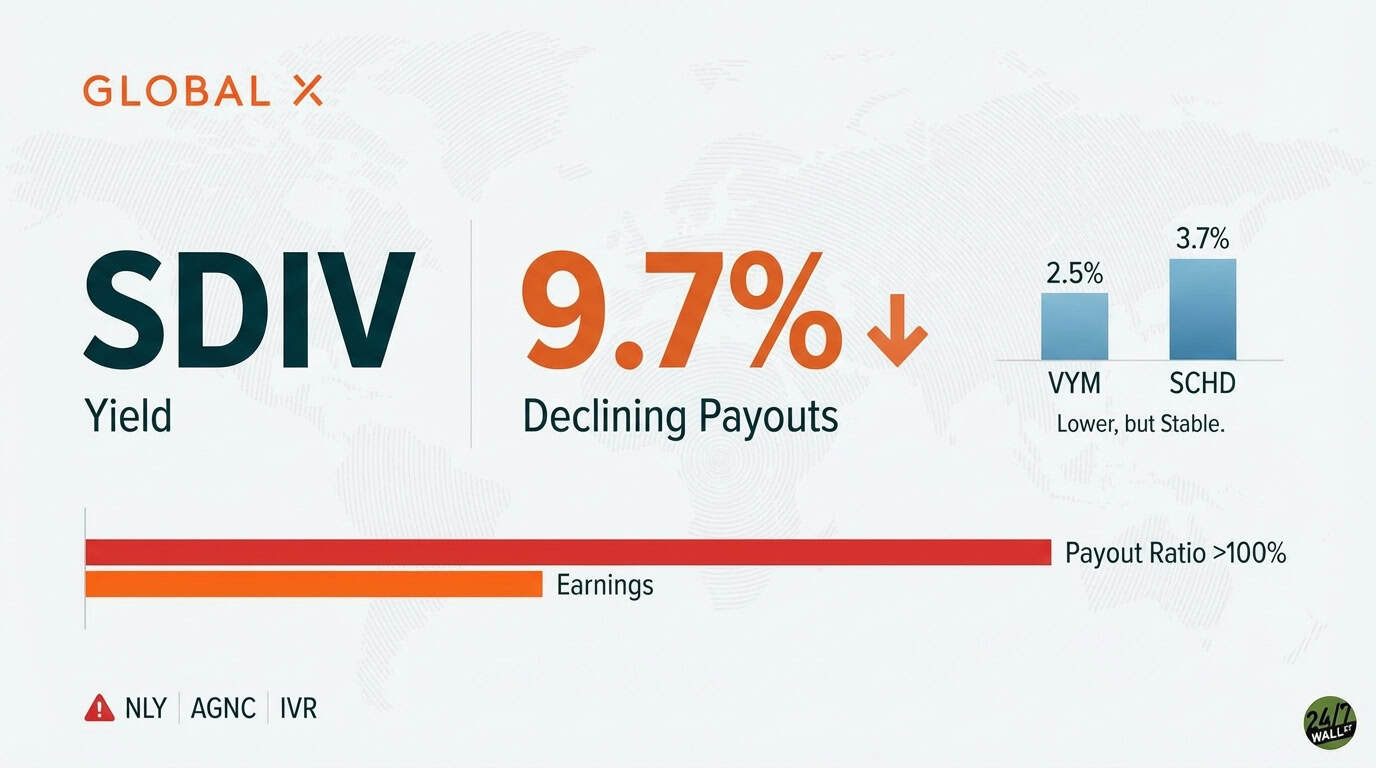
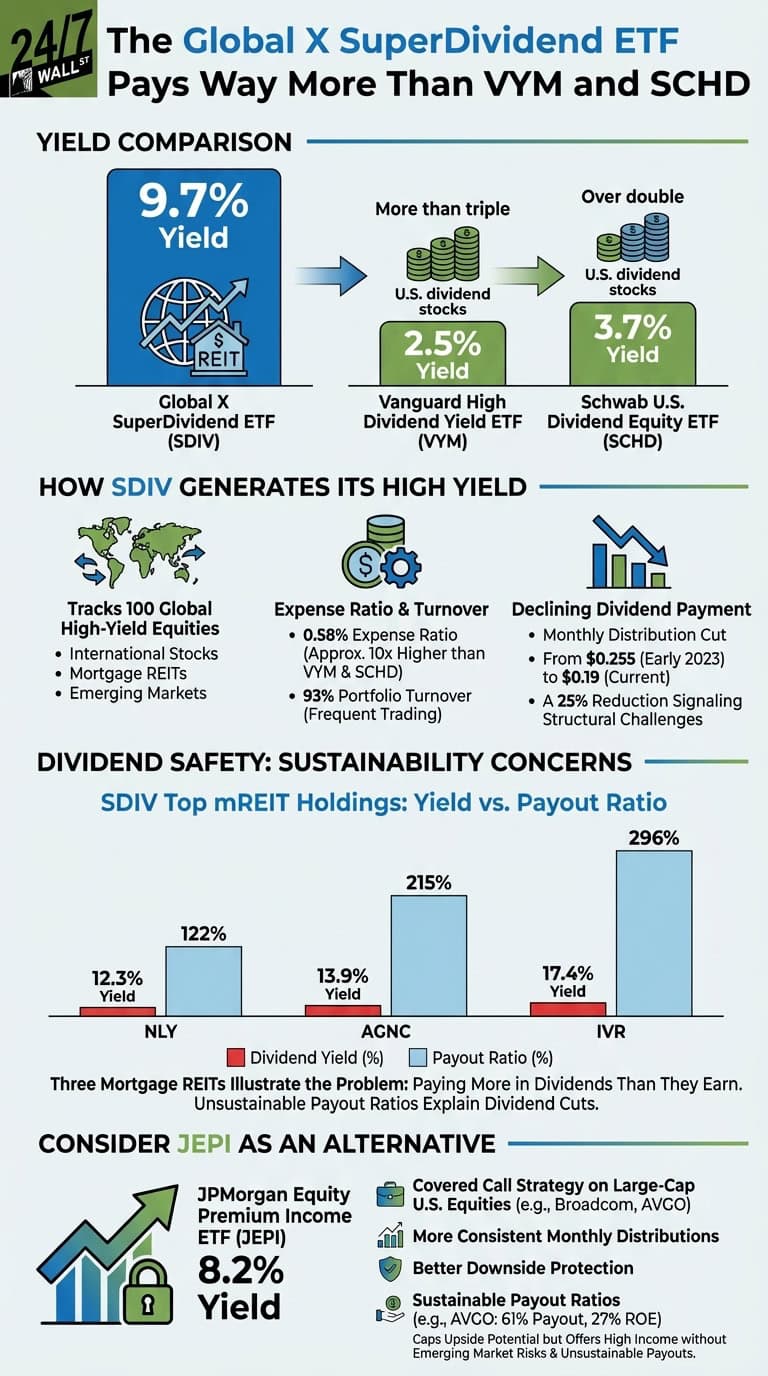
The Global X SuperDividend ETF (NYSEARCA:SDIV) delivers a 9.7% dividend yield, more than triple the 2.5% offered by the Vanguard High Dividend Yield ETF (NYSEARCA:VYM | VYM Price Prediction) and over double the 3.7% from the Schwab U.S. Dividend Equity ETF (NYSEARCA:SCHD). This international ETF tracks 100 of the world’s highest-yielding equities, with significant exposure to mortgage REITs, Brazilian companies, and emerging markets. However, that exceptional yield comes with serious sustainability concerns.

How SDIV Generates Its High Yield

SDIV holds dividend-paying equities from global markets, with heavy concentration in mortgage REITs and international stocks. The fund’s 0.58% expense ratio is nearly 10 times higher than VYM and SCHD, and its 93% portfolio turnover suggests frequent trading that can erode returns. The ETF’s dividend has declined from $0.255 per month in early 2023 to $0.19 currently, representing a 25% cut that signals structural challenges.

Dividend Safety Analysis: Top Holdings

SDIV’s largest U.S. holdings reveal why the high yield may not be sustainable. Three mortgage REITs illustrate the core problem with paying more in dividends than they earn:

Annaly Capital Management (NYSE:NLY), weighted at 0.91%, pays a 12.3% yield but has a 122% payout ratio, distributing $2.75 annually against earnings of just $2.26 per share. AGNC Investment (NASDAQ:AGNC) at 0.85% weighting shows a 215% payout ratio, paying $1.44 against $0.67 in earnings. Invesco Mortgage Capital (NYSEARCA:IVR) at 0.79% presents the most concerning profile, delivering a 17.4% yield with a 296% payout ratio.

These unsustainable payout ratios explain SDIV’s dividend cuts. Mortgage REITs are highly leveraged and sensitive to interest rate volatility, with book values that can decline rapidly. While recent quarters showed improved returns as Fed rate cuts supported spreads, the structural challenge remains: these companies cannot indefinitely pay out multiples of their earnings.

An infographic titled 'The Global X SuperDividend ETF Pays Way More Than VYM and SCHD'. The Yield Comparison section shows Global X SuperDividend ETF (SDIV) with a 9.7% yield, compared to Vanguard High Dividend Yield ETF (VYM) with 2.5% (more than triple for SDIV) and Schwab U.S. Dividend Equity ETF (SCHD) with 3.7% (over double for SDIV). The 'How SDIV Generates Its High Yield' section lists: it tracks 100 global high-yield equities (international stocks, mortgage REITs, emerging markets); has a 0.58% expense ratio (approx. 10x higher than VYM & SCHD) and 93% portfolio turnover; and shows declining dividend payments, with a monthly distribution cut from $0.255 (Early 2023) to $0.19 (Current), a 25% reduction signaling structural challenges. The 'Dividend Safety: Sustainability Concerns' section displays a bar chart for SDIV's top mREIT holdings, NLY, AGNC, and IVR, comparing their Dividend Yield (%) (red bars) vs. Payout Ratio (%) (light blue bars). NLY has a 12.3% yield and 122% payout ratio. AGNC has a 13.9% yield and 215% payout ratio. IVR has a 17.4% yield and 296% payout ratio. Text below states: 'Three Mortgage REITs Illustrate the Problem: Paying More in Dividends Than They Earn. Unsustainable Payout Ratios Explain Dividend Cuts.' The 'Consider JEPI As An Alternative' section highlights JPMorgan Equity Premium Income ETF (JEPI) with an 8.2% yield. Its features include a Covered Call Strategy on Large-Cap U.S. Equities (e.g., Broadcom, AVGO), More Consistent Monthly Distributions, Better Downside Protection, and Sustainable Payout Ratios (e.g., AVGO: 61% Payout, 27% ROE). Text notes JEPI 'Caps Upside Potential but Offers High Income without Emerging Market Risks & Unsustainable Payouts.'
24/7 Wall St.
This infographic compares the high yield of the Global X SuperDividend ETF (SDIV) with lower-yield ETFs

Consider JEPI as an Alternative

For investors seeking high income with better sustainability, the JPMorgan Equity Premium Income ETF (NYSEARCA:JEPI) offers an 8.2% yield through a covered call strategy on large-cap U.S. equities. JEPI generates income by selling call options on holdings like Broadcom (NASDAQ:AVGO), which has a sustainable 61% payout ratio and 27% return on equity.

The JPMorgan Equity Premium Income ETF’s monthly distributions have remained more consistent than SDIV’s declining payouts, and the fund’s focus on quality U.S. companies provides better downside protection. While JEPI caps upside potential through its options strategy, it delivers high income without the emerging market risks and unsustainable payout ratios that plague SDIV.

Photo of Michael Williams
About the Author Michael Williams →

I am a long time investor and student of business, and believe finding good companies that can become great investments is the best game on earth. After 20 years of writing and researching the public markets it is clear that individuals have never had more tools and information to take control of their financial lives. From ETFs and $0 commissions to cryptos and prediction markets there has never been a greater democratization of access to investing. 

I write to help people understand the investments available to them so they can make the best choice for their portfolio, whether they're starting out or looking for income in retirement. 

Featured Reads

Our top personal finance-related articles today. Your wallet will thank you later.

Continue Reading

Top Gaining Stocks

CBOE Vol: 1,568,143
PSKY Vol: 12,285,993
STX Vol: 7,378,346
ORCL Vol: 26,317,675
DDOG Vol: 6,247,779

Top Losing Stocks

LKQ
LKQ Vol: 4,367,433
CLX Vol: 13,260,523
SYK Vol: 4,519,455
MHK Vol: 1,859,865
AMGN Vol: 3,818,618