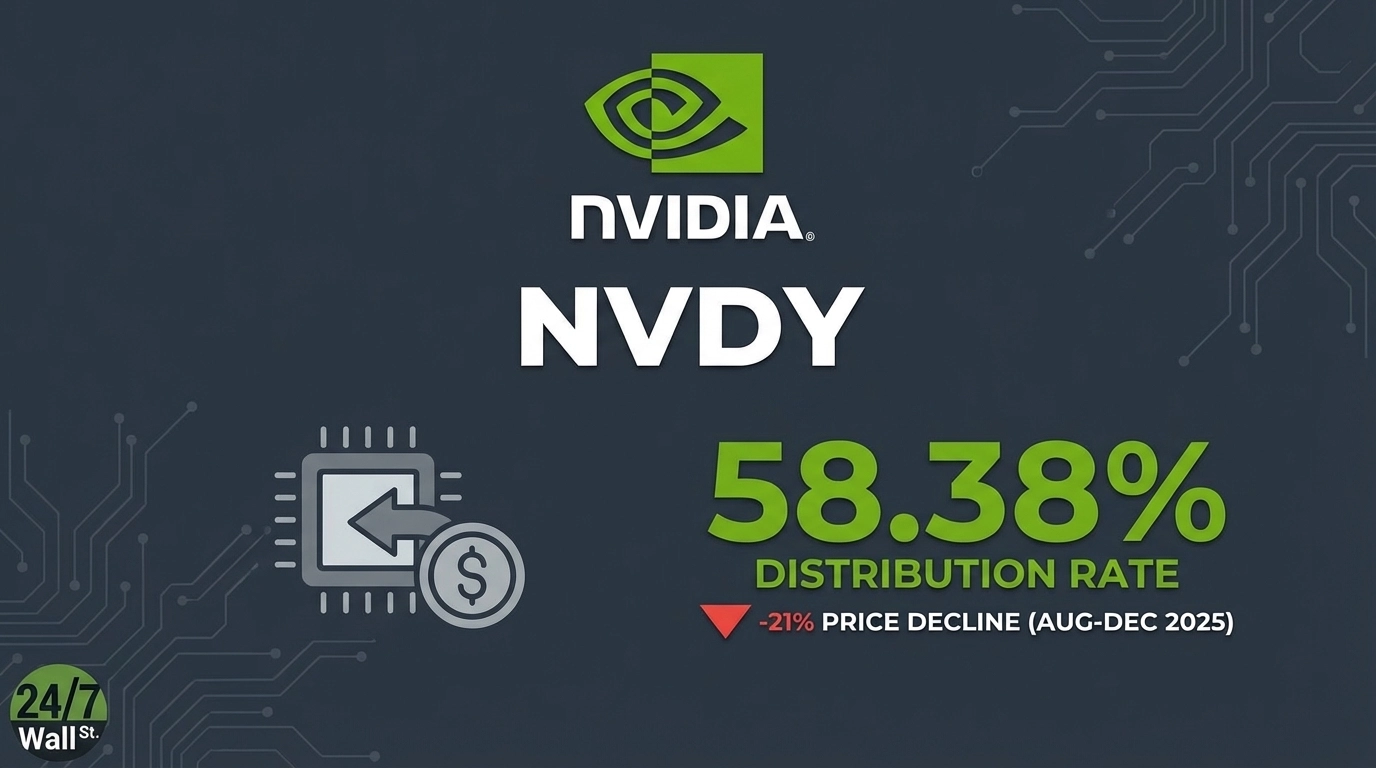
YieldMax NVDA Option Income Strategy ETF (NYSEARCA:NVDY) attracts income-focused investors with weekly distributions generated from Nvidia (NASDAQ:NVDA | NVDA Price Prediction). The fund uses a synthetic covered call strategy, selling call options and spreads to capture premiums while maintaining exposure to the chipmaker’s price movements. With a 58.38% distribution rate as of December 10, 2025, NVDY offers income that dwarfs traditional dividend strategies. But the fund’s 21% decline from its August peak to $14.10 raises a critical question: are investors earning income or receiving their capital back in installments?
How NVDY Generates Income Through Options
NVDY produces distributions by selling call options on Nvidia shares without holding NVDA stock directly. It uses long-dated call options to create synthetic exposure while selling shorter-term calls to collect premiums. This generates substantial income during high volatility, as option premiums increase when prices swing dramatically.
Recent distributions illustrate this variability. NVDY paid $0.15 per share on December 12, following payments of $0.16 and $0.15 in prior weeks. However, the fund paid $0.80 on October 10 and $0.32 on November 7. The fund transitioned to weekly distributions in October 2025 after previously paying monthly, providing more frequent but inconsistent income.
The Volatility Tax on Total Returns
NVDY’s income generation comes with capped upside and full downside participation. While the fund distributed approximately $11.91 per share over the past year, creating an 84% yield based on current price, the ETF declined from $17.86 in August to $14.10 in December. Investors experienced both generous distributions and substantial capital erosion.
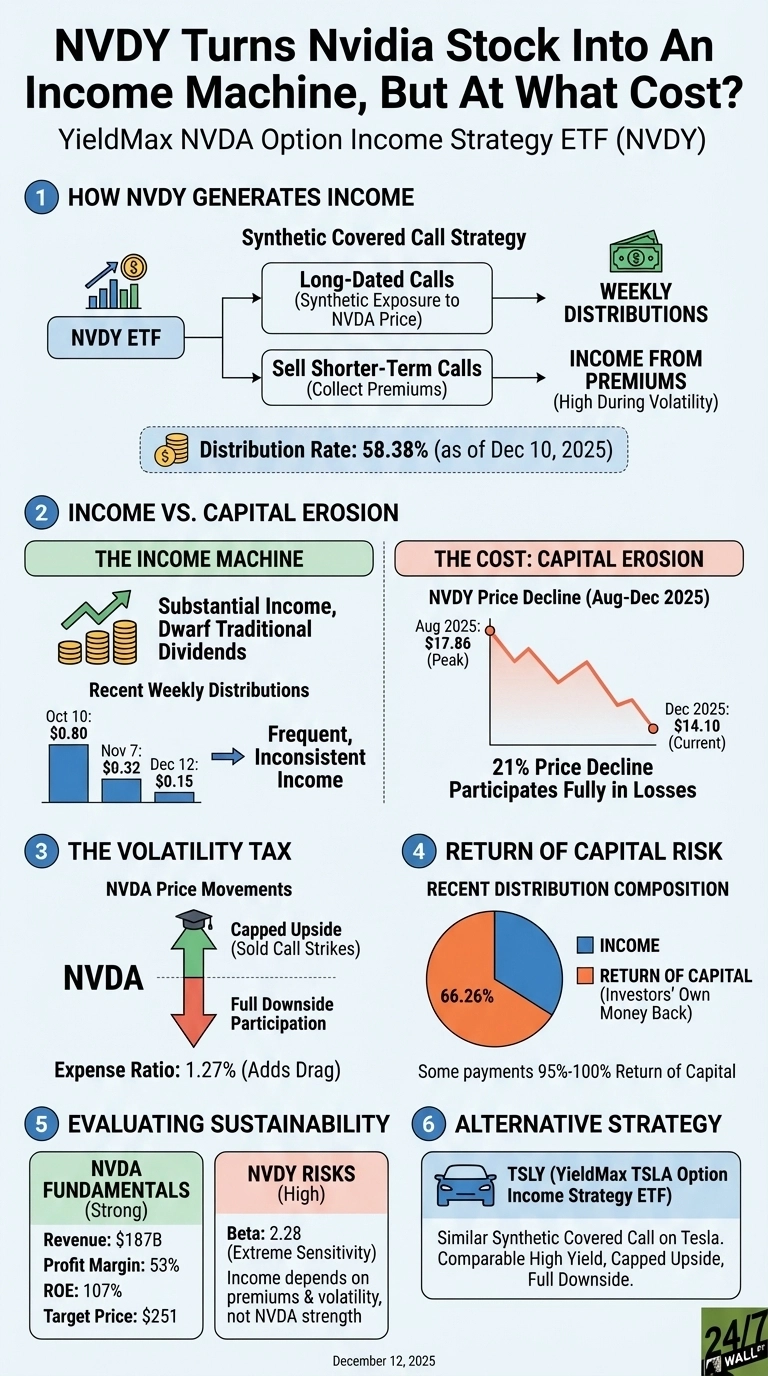
The challenge stems from Nvidia’s recent volatility. The stock declined 20% from its October peak of $212 to a November low of $170. When NVDA rallies sharply, NVDY’s upside is capped at sold call strike prices. When NVDA declines, the fund participates fully in losses. The 1.27% expense ratio adds additional drag.
Notably, 66.26% of the most recent distribution was classified as return of capital rather than income, meaning investors received their own money back rather than investment gains. Some payments consisted of 95% to 100% return of capital.
Evaluating NVDY’s Income Sustainability
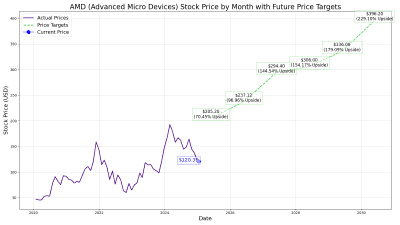
NVDY’s distribution sustainability depends entirely on Nvidia’s volatility and premiums from selling call options. Nvidia’s fundamentals remain exceptional, with $187 billion in trailing revenue, 53% profit margins, and 107% return on equity. The company dominates AI accelerator markets and maintains pricing power across data center, gaming, and professional visualization segments. Analysts maintain a consensus target price of $251, suggesting 43% upside from current levels around $175.
However, NVDY holders don’t benefit directly from Nvidia’s business strength like equity holders. The fund’s distributions fluctuate with option premium levels, which rise during volatility but provide no guaranteed income floor. The fund’s beta of 2.28 reflects extreme price sensitivity, creating both opportunity for premium collection and risk of capital loss exceeding any income received.
Alternative: TSLY Offers Similar Strategy on Different Underlying
The YieldMax TSLA Option Income Strategy ETF (NYSEARCA:TSLY) provides a comparable alternative using the same synthetic covered call methodology on Tesla. TSLY generates weekly income through options on Tesla stock, offering a distribution rate similarly exceeding 60% while maintaining the same trade-offs of capped upside and full downside exposure. Like NVDY, TSLY’s distributions vary significantly based on market conditions and consist primarily of return of capital during periods of underlying stock weakness.