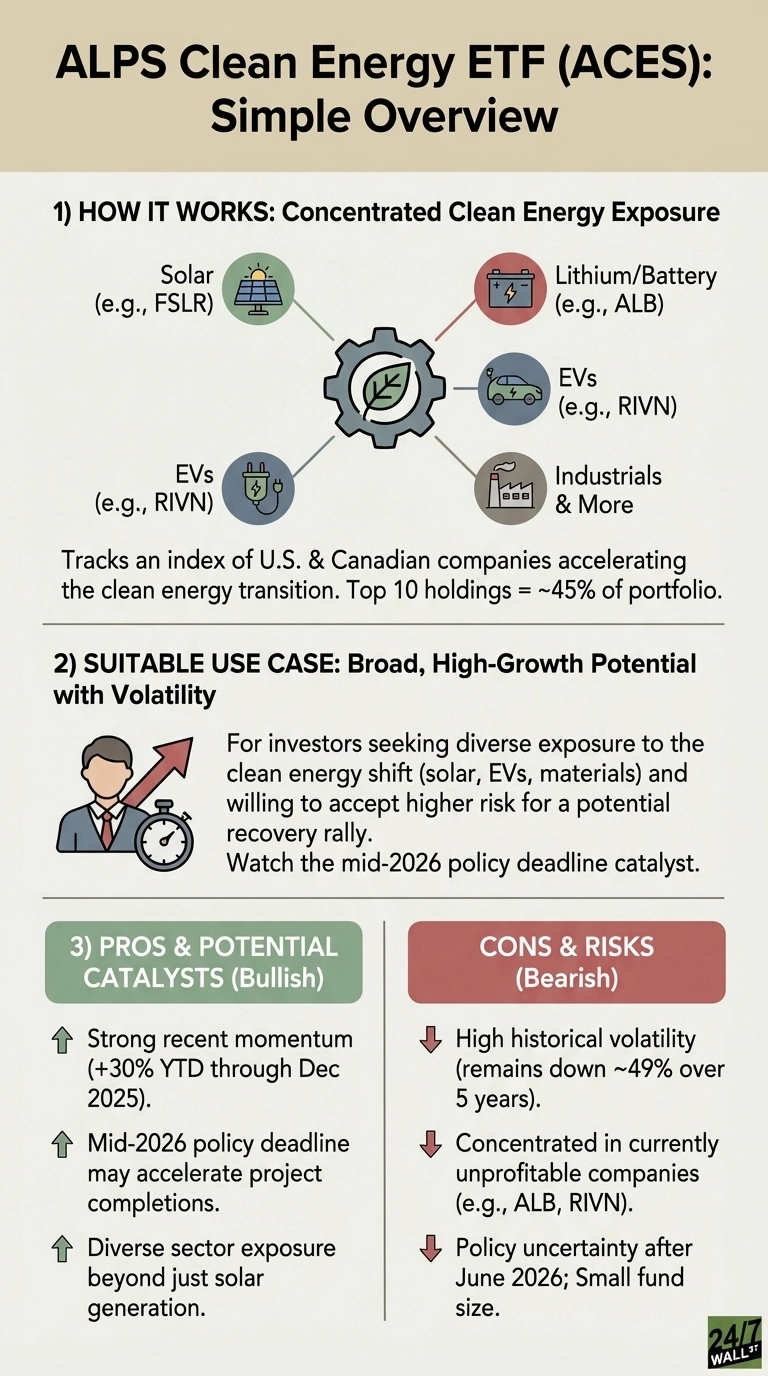
ALPS Clean Energy ETF (NYSEARCA:ACES) has surged 30% year-to-date through, nearly doubling the S&P 500’s 16% gain. But context matters: ACES remains down 49% over five years, trading around $33.60 versus its 2020 peak above $66. This is a recovery rally, not a breakout. The question heading into 2026 is whether momentum can continue or structural headwinds will reassert themselves.
The Policy Clock Is Ticking
The biggest macro factor is the June 30, 2026 deadline in the One Big Beautiful Bill Act (OBBBA), signed July 4, 2025. This legislation modified the Inflation Reduction Act’s clean energy tax credits, requiring most renewable projects be placed in service by mid-2026 to qualify. According to IRS guidance, credits for residential solar, commercial clean vehicles, and energy-efficient homes all sunset after that date.
This creates a double-edged sword. The deadline could accelerate project completions and boost near-term revenue for holdings like First Solar (NASDAQ:FSLR | FSLR Price Prediction), the fund’s third-largest position at 5.55%, already up 51% year-to-date. But policy uncertainty beyond June 2026 raises questions about demand sustainability. Monitor quarterly earnings calls from top holdings for commentary on project pipelines and how companies navigate the compressed timeline. The Solar Energy Industries Association publishes quarterly installation data revealing whether developers are racing to beat the deadline or pulling back.
What’s Under the Hood Matters More Than Ever
With just $108.7 million in assets, ACES is a small fund with concentrated bets. The top ten holdings represent roughly 45% of the portfolio, meaning individual stock performance drives returns more than sector tailwinds. Albemarle (NYSE:ALB), the largest holding at 6.91%, remains unprofitable despite being a leading lithium producer. The company trades with a forward price-to-earnings ratio above 320x, pricing in an aggressive recovery that hasn’t materialized.
Rivian (NASDAQ:RIVN) at 5.50% posted a 20.57% gain in the week ending December 19, contributing meaningfully to ACES’s recent momentum. But Rivian operates at a 61% profit margin deficit with quarterly revenue growth of 78% that hasn’t translated to profitability. Track monthly delivery reports from Rivian and other EV holdings, watching whether production scaling narrows losses or cash burn accelerates.
Check the fund’s monthly fact sheet from ALPS for holdings changes and sector drift. With 32% allocated to industrials and 14% to consumer discretionary, ACES is more exposed to manufacturing and EV adoption than pure renewable generation. That composition makes it sensitive to both consumer spending trends and industrial capex cycles.
Consider the Invesco Solar ETF Instead
Invesco Solar ETF (NYSEARCA:TAN) offers purer solar exposure with substantially larger assets, providing better liquidity and tighter bid-ask spreads. TAN’s 48% year-to-date gain exceeds ACES’s performance, and its recent one-month momentum of 2.88% suggests solar stocks are leading the clean energy recovery. For investors who believe solar manufacturing and installation will benefit most from the 2026 deadline rush, TAN provides more concentrated exposure without the lithium and EV volatility embedded in ACES.
The path forward for ACES depends on whether the June 2026 policy deadline accelerates project completions enough to offset post-deadline uncertainty, and whether its concentrated holdings in unprofitable EV and battery companies can finally turn operational momentum into earnings growth.