Why GLD’s 74% Rally Turned Into a Mousetrap and What the Fed Chair Pick Means Now

Photo of Michael Williams
By Michael Williams Published

Quick Read

  • SPDR Gold Trust (GLD) plunged from $470 to $445 on January 30. iShares Silver Trust (SLV) crashed 25% intraday.

  • GLD selloff was derivatives-driven liquidation. CME hiked margin requirements forcing leveraged traders to exit positions.

  • Dollar strength is gold’s biggest macro headwind. Warsh’s Fed chair nomination was interpreted as hawkish.

This post may contain links from our sponsors and affiliates, and Flywheel Publishing may receive compensation for actions taken through them.
Why GLD’s 74% Rally Turned Into a Mousetrap and What the Fed Chair Pick Means Now

© 24/7 Wall St.

Gold looked unstoppable heading into late January, with the SPDR Gold Trust (NYSEARCA:GLD | GLD Price Prediction) climbing 74% over the prior year as retail investors piled in. The momentum seemed relentless until everything changed on January 30.

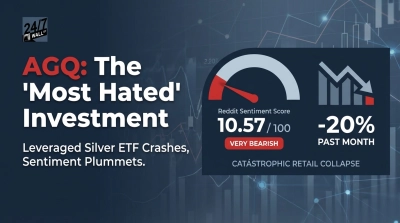
That day marked a violent reversal as GLD plunged from an intraday high near $470 to close at $445. The selling wasn’t isolated to gold—silver crashed even harder with the iShares Silver Trust (NYSEARCA:SLV) experiencing a 25% intraday drop that signaled broad-based precious metals liquidation. The pressure continued through the following week as GLD shed another 5.2%, transforming what looked like a breakout into what some investors started calling “the mousetrap.”

The Dollar Matters More Than You Think

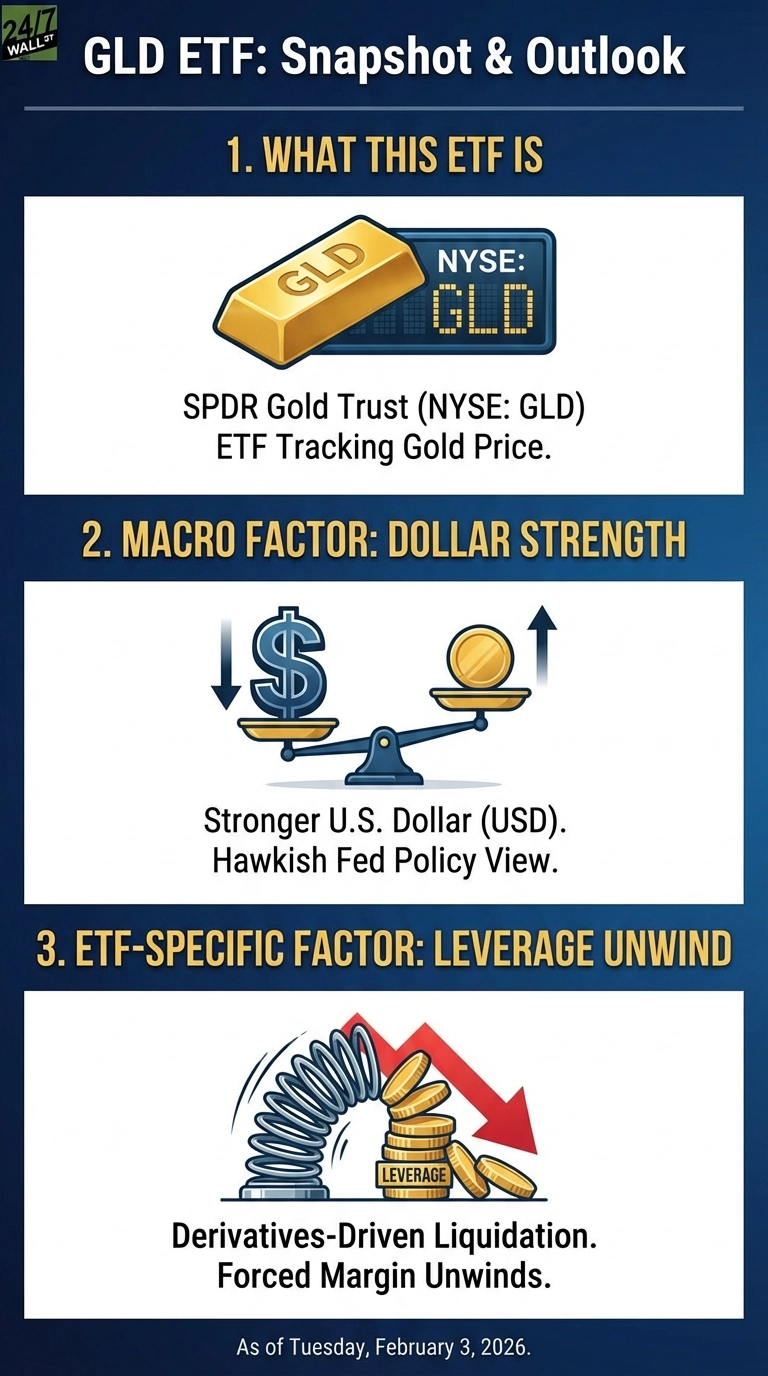
Gold’s biggest macro headwind is dollar strength. When President Trump nominated Kevin Warsh as Fed chair on January 30, markets interpreted it as hawkish. Warsh prioritizes inflation control over accommodation, which supports the dollar. A stronger dollar makes gold more expensive for foreign buyers and reduces its appeal as a currency hedge. Watch the U.S. Dollar Index weekly. If it breaks above recent highs near 110, gold faces continued pressure. If it weakens toward 105, that removes a major constraint on the upside. The Federal Reserve’s monthly policy statements and quarterly economic projections also matter, as any shift toward tighter policy or higher rate expectations will reinforce dollar strength.

An infographic titled 'GLD ETF: Snapshot & Outlook' on a dark blue background. It is divided into three sections with white backgrounds and a footer. Section 1, 'WHAT THIS ETF IS', shows a gold bar labeled 'GLD' next to a digital display showing 'NYSE: GLD'. Text below reads: 'SPDR Gold Trust (NYSE: GLD) ETF Tracking Gold Price.' Section 2, 'MACRO FACTOR: DOLLAR STRENGTH', displays a balance scale with a dollar sign on the left, an arrow pointing down, and a gold coin on the right, an arrow pointing up. Text below reads: 'Stronger U.S. Dollar (USD). Hawkish Fed Policy View.' Section 3, 'ETF-SPECIFIC FACTOR: LEVERAGE UNWIND', shows a spring pushing down on a stack of gold coins labeled 'LEVERAGE', with a large red downward arrow behind them. Text below reads: 'Derivatives-Driven Liquidation. Forced Margin Unwinds.' The footer states: 'As of Tuesday, February 3, 2026.'
24/7 Wall St.
This infographic, updated as of Tuesday, February 3, 2026, outlines the SPDR Gold Trust ETF (GLD), highlighting macro and ETF-specific factors influencing its price.

Leverage Unwind, Not Fundamentals

The selloff wasn’t driven by collapsing demand for physical gold. It was a derivatives-driven liquidation. The CME responded by hiking margin requirements on gold and silver futures after the crash, forcing leveraged traders to exit positions and creating a cascade effect unrelated to gold’s underlying value. The key signal to watch is GLD’s daily trading volume and its price relationship to net asset value. When volume normalizes to lower levels and the ETF trades close to its NAV, the forced selling will be over and fundamentals can reassert themselves. You can find NAV data on State Street’s GLD fact sheet, updated daily. If volume remains elevated and the ETF trades at a discount to NAV, it signals continued liquidation pressure.

The key takeaway: dollar strength will determine whether GLD stabilizes or falls further, while the pace of leveraged position unwinding will dictate near-term volatility and whether the current price represents a floor or another leg down.

Photo of Michael Williams
About the Author Michael Williams →

I am a long time investor and student of business, and believe finding good companies that can become great investments is the best game on earth. After 20 years of writing and researching the public markets it is clear that individuals have never had more tools and information to take control of their financial lives. From ETFs and $0 commissions to cryptos and prediction markets there has never been a greater democratization of access to investing. 

I write to help people understand the investments available to them so they can make the best choice for their portfolio, whether they're starting out or looking for income in retirement. 

Featured Reads

Our top personal finance-related articles today. Your wallet will thank you later.

Continue Reading

Top Gaining Stocks

CBOE Vol: 1,568,143
PSKY Vol: 12,285,993
STX Vol: 7,378,346
ORCL Vol: 26,317,675
DDOG Vol: 6,247,779

Top Losing Stocks

LKQ
LKQ Vol: 4,367,433
CLX Vol: 13,260,523
SYK Vol: 4,519,455
MHK Vol: 1,859,865
AMGN Vol: 3,818,618