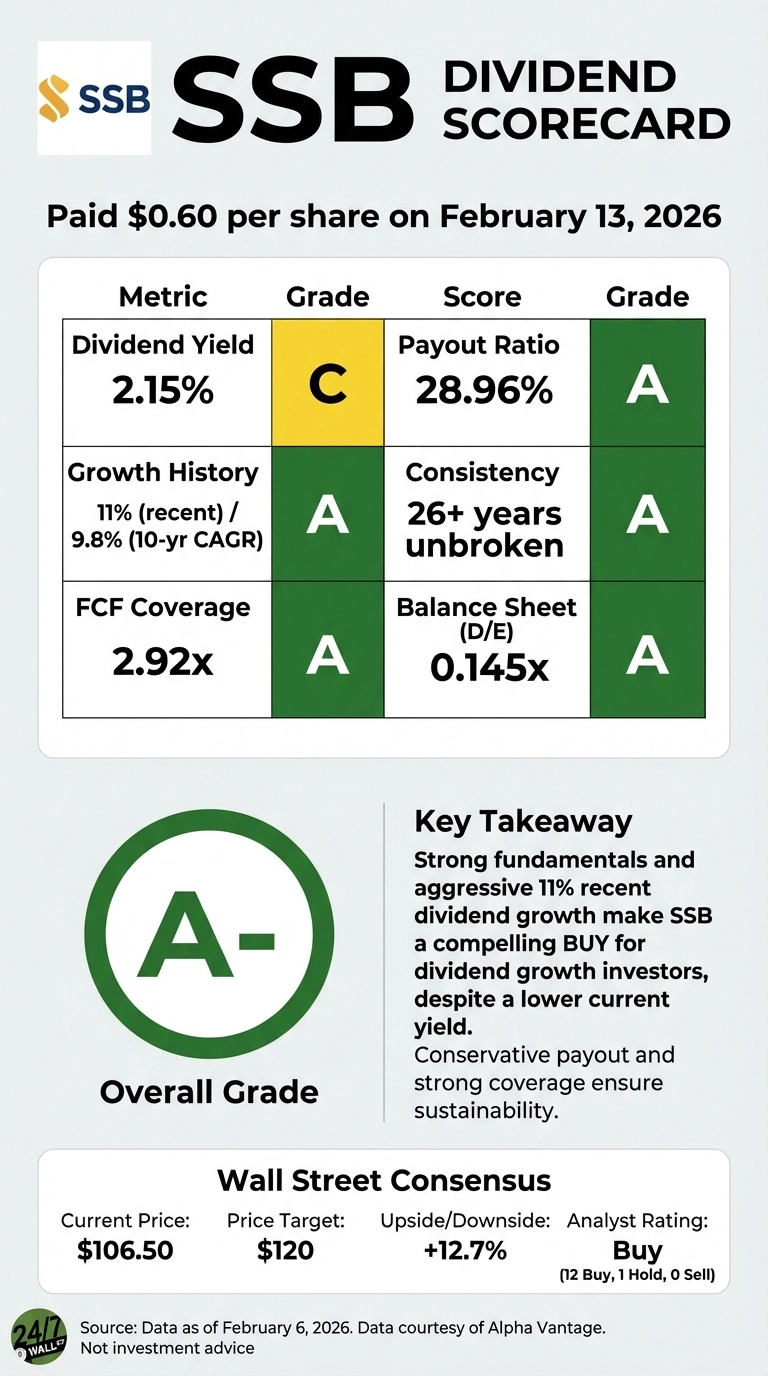
SouthState Corporation (NYSE: SSB) | SSB Price Prediction just handed shareholders a quarterly dividend of 60 cents with a record date of Feb. 6, and payment scheduled for Feb. 13, 2026. The regional bank’s 2.15% yield sits below the financials sector average, but the underlying fundamentals tell a more nuanced story about dividend quality and growth trajectory that warrants closer examination alongside its peer institutions.
SSB’s Dividend Profile: Growth Over Yield
SouthState’s current quarterly payout represents the highest dividend in the company’s 26-year payment history. The bank increased its dividend 11% year-over-year (YOY), accelerating from the 8% increase seen in 2024. This acceleration matters: The 10-year compound annual growth rate (CAGR) of 9.8% significantly outpaces inflation and demonstrates management’s confidence in the bank’s earning power.
The payout ratio provides critical context. At 28.96% of trailing earnings, SSB maintains one of the most conservative dividend structures among the comparison group. The company has increased its dividend for 13 consecutive years, and has an annualized five-year dividend growth rate of 3.93% and a 10-year rate of 9.8%.
Regional Bank Comparison: USB and PNC Set the Bar
U.S. Bancorp (NYSE: USB) maintains a 3.43% dividend yield with a quarterly payout of 52 cents, translating to $2.04 per share annually. The higher yield reflects USB’s position as a larger, more mature institution with a $94.37 billion market capitalization compared to SSB’s $10.69 billion. USB increased its dividend to 52 cents in the third and fourth quarters of 2025, up from 50 cents in the second quarter, demonstrating recovery momentum following 2023’s regional banking stress.
PNC Financial Services (NYSE: PNC) offers a dividend yielding 2.80%, or $1.70 per share quarterly, which the bank recently paid on Feb. 5. PNC raised its payout 6.25% in Q3 2025 after a more modest 3.23% increase earlier that year. PNC’s 36.7% payout ratio based on operating cash flow provides substantial room for continued growth, while its debt-to-equity ratio improved from 1.42x in 2023 to 0.94x in 2025, reflecting strengthening financial flexibility.
Dividend Aristocrats Provide Context
Among blue-chip dividend payers, Procter & Gamble (NYSE: PG) declared a $1.0568 quarterly dividend with a 2.66% yield. The consumer staples giant increased its dividend 5.0% in 2025 following a 7.0% increase in 2024. PG’s 61.2% payout ratio sits at the higher end of sustainable levels, but the company’s $17.8 billion in operating cash flow covered the $9.9 billion dividend payout by 1.80x in fiscal 2025.
Johnson & Johnson (NYSE: JNJ), with its 63-year dividend growth streak, pays $1.30 quarterly for a 2.19% yield. The healthcare giant increased its dividend 4.8% in 2025, maintaining a 46.6% payout ratio that balances shareholder returns with reinvestment capacity. JNJ’s $155.8 billion in retained earnings provides an enormous cushion for dividend sustainability through economic cycles.
The Dividend Quality Framework
SSB’s dividend stands out not for its current yield but for its growth trajectory and financial backing. The bank’s 10.7% return on equity and 31.2% profit margin demonstrate operational efficiency that supports dividend expansion. The 0.145 debt-to-equity ratio provides financial flexibility, while $6.9 billion in cash and short-term investments ensures liquidity.
The comparison reveals a fundamental trade-off between higher current yields from mature banks and growth potential from regional banks like SSB. Investors seeking immediate income gravitate toward USB’s 3.43%, accepting slower dividend growth. Those prioritizing total return favor SSB’s 11% growth rate despite the lower 2.15% starting yield, betting that compounding dividend increases will eventually produce superior income streams.
The broader context matters for dividend sustainability. SSB’s 30.9% quarterly earnings growth and 53.2% revenue growth year-over-year reflect the benefits of recent acquisitions and organic expansion. With 86.51% institutional ownership and a consensus target price of $120 versus the current level near $106.50, the market appears to recognize the bank’s improving fundamentals.
For income-focused portfolios, the dividend scorecard suggests diversification across yield levels and growth rates. Combining SSB’s growth potential with USB’s higher current yield and adding dividend aristocrats like PG or JNJ creates a balanced approach that addresses both immediate income needs and long-term purchasing power protection through dividend growth.