
Chord Energy (NASDAQ:CHRD | CHRD Price Prediction) has spent the past year proving it can squeeze more oil out of the Williston Basin for less money, and it recently hit its goal of 80% long-lateral inventory ahead of schedule. The question investors need to answer is whether this basin-dominant scale is a competitive moat or a structural vulnerability dressed up in efficiency language.
The Efficiency Case Is Real
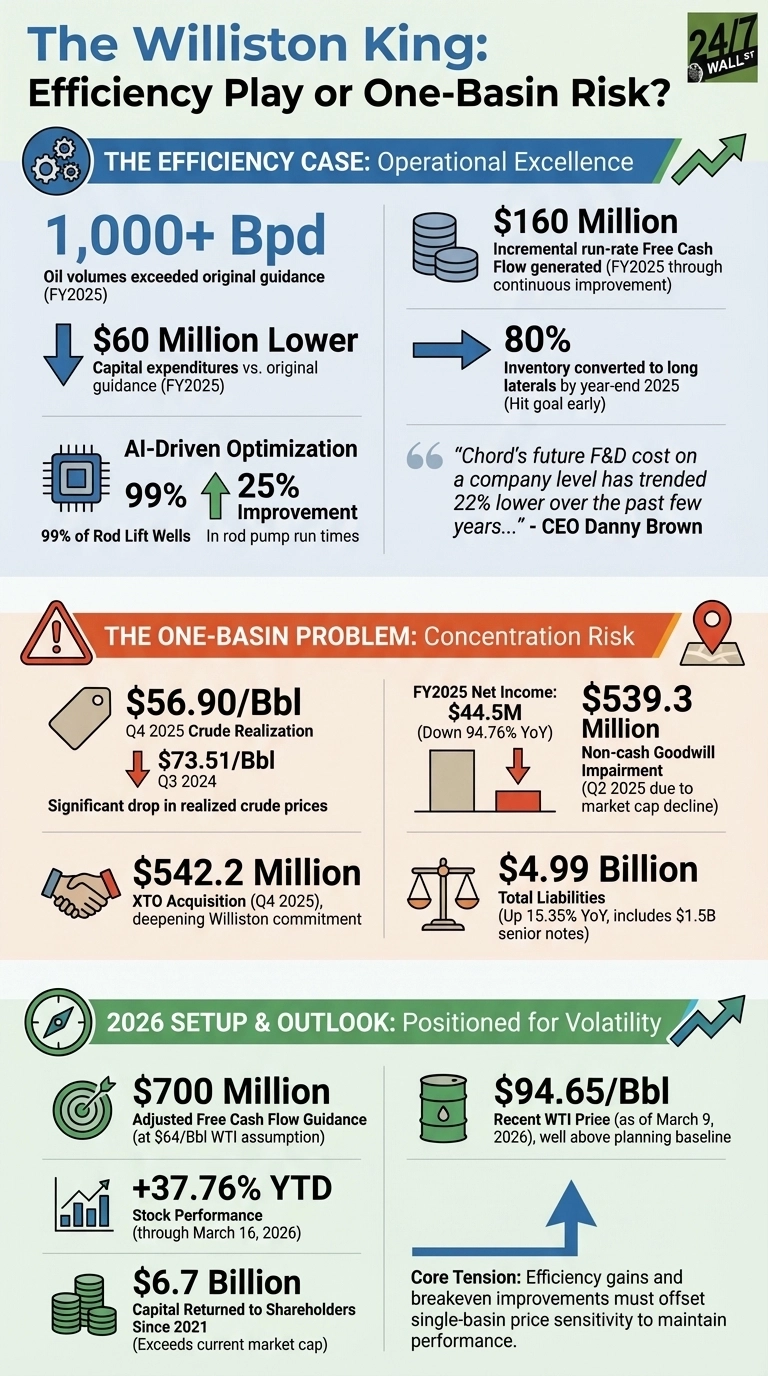
The numbers behind the efficiency story are not talking points. In FY2025, Chord delivered oil volumes that exceeded original guidance by more than 1,000 barrels per day while capital came in approximately $60 million lower. Full-year CapEx landed more than $100 million below pro forma FY24, with oil volumes 1% higher year over year, and the company generated approximately $160 million in incremental run-rate free cash flow through continuous improvement.
The 4-mile lateral program is the structural driver. CEO Danny Brown set a goal of converting 80% of inventory to long laterals by year-end 2025 and hit it early. “Chord’s future F&D cost on a company level has trended 22% lower over the past few years, clearly demonstrating that things are going in a positive direction,” Brown said on the February 26 earnings call. Seven 4-mile wells came online in FY25 at or above production expectations and below budget, with well costs reduced more than 10% versus initial 2025 budget designs. AI-driven optimization now covers approximately 99% of wells on rod lift, delivering a 25% improvement in rod pump run times.
The One-Basin Problem
Every efficiency gain sits inside a single zip code, and that concentration amplified the damage when crude realizations fell from $73.51/Bbl in Q3 2024 to $56.90/Bbl in Q4 2025. The result led to FY2025 net income of $44.5 million, down 94.76% year over year, and a $539.3 million non-cash goodwill impairment in Q2 2025, triggered by a decline in market cap. Operating income dropped 82.05% year over year to $197.4 million despite cost discipline.
The XTO acquisition, closed in Q4 2025 for approximately $542.2 million, deepened the Williston commitment rather than diversifying away from it. Total liabilities rose 15.35% year over year to $4.99 billion, partially reflecting the $1.5 billion senior notes issuance.
The 2026 Setup
Chord’s 2026 guidance targets $700 million in adjusted free cash flow at $64/Bbl WTI. That assumption now looks conservative: WTI recently traded near $94.65/Bbl as of March 9, 2026, well above the planning baseline. With this pricing, the stock has responded, up 37.76% year to date through March 16. Analyst consensus sits at a $134.24 price target, with 13 buy or strong buy ratings and 0 sell ratings.
Brown’s framing is unambiguous: “Chord is well positioned to handle the ongoing volatility with commodity prices, generating solid free cash flow at current prices, with notable upside to the next upcycle.” The company has also returned $6.7 billion to shareholders since 2021, a figure exceeding its current market cap.
The tension is not resolved by efficiency alone. Chord’s breakeven improvements and lateral conversions are real, but they operate entirely within one basin’s price deck. If WTI retreats toward or below the $64 guidance assumption, the efficiency story faces a direct test. Crude realization trends and the pace of 4-mile lateral TILs remain the key operational metrics to watch as the company navigates geographic concentration risk.
Data Sources
- Chord Energy Q4 2025 earnings release (SEC 8-K, accession 0001486159-26-000004) and February 26, 2026 earnings call transcript, used for operational metrics, CEO quotes, and 2026 guidance details
- FRED/Alpha Vantage WTI crude oil price data, used to contextualize CHRD’s $64/Bbl guidance assumption against current spot prices
- The $6.7 Billion Statement That Stops Chord Energy Investors Cold, referenced for prior coverage context on capital returns and earnings dynamics
- User-provided source documents on Chord Energy capital returns and DCF valuation, used for context on dividend sustainability and long lateral efficiency gains [Source: Chord Energy Capital Returns And Long Laterals Reshape Dividend Sustainability Story]