Centuri’s Backlog Is Booming, But Its Debt and Valuation Still Loom Large

Photo of David Beren
By David Beren Published

Quick Read

  • Centuri Holdings (CTRI) ended 2025 with a $5.9 billion backlog, up 59% year-over-year, with $1.1 billion in 2026 year-to-date bookings covering over 85% of base revenue guidance; net debt to adjusted EBITDA fell to 2.5x from 3.6x at year-end 2024, with a 2.0x target by end of 2026. The company achieved a 1.5x book-to-bill ratio in 2025 and identified $1.3 billion in “real” data center contracts being tendered.

  • Grid modernization demand and data center power needs are driving Centuri’s surging backlog, but the stock’s 122x trailing P/E and 85.75% one-year gain have priced in substantial growth, leaving little room for execution missteps as the company works to improve margins and meet aggressive earnings targets.

This post may contain links from our sponsors and affiliates, and Flywheel Publishing may receive compensation for actions taken through them.
Centuri’s Backlog Is Booming, But Its Debt and Valuation Still Loom Large

© Courtesy of FirstEnergy Corp. via Flickr

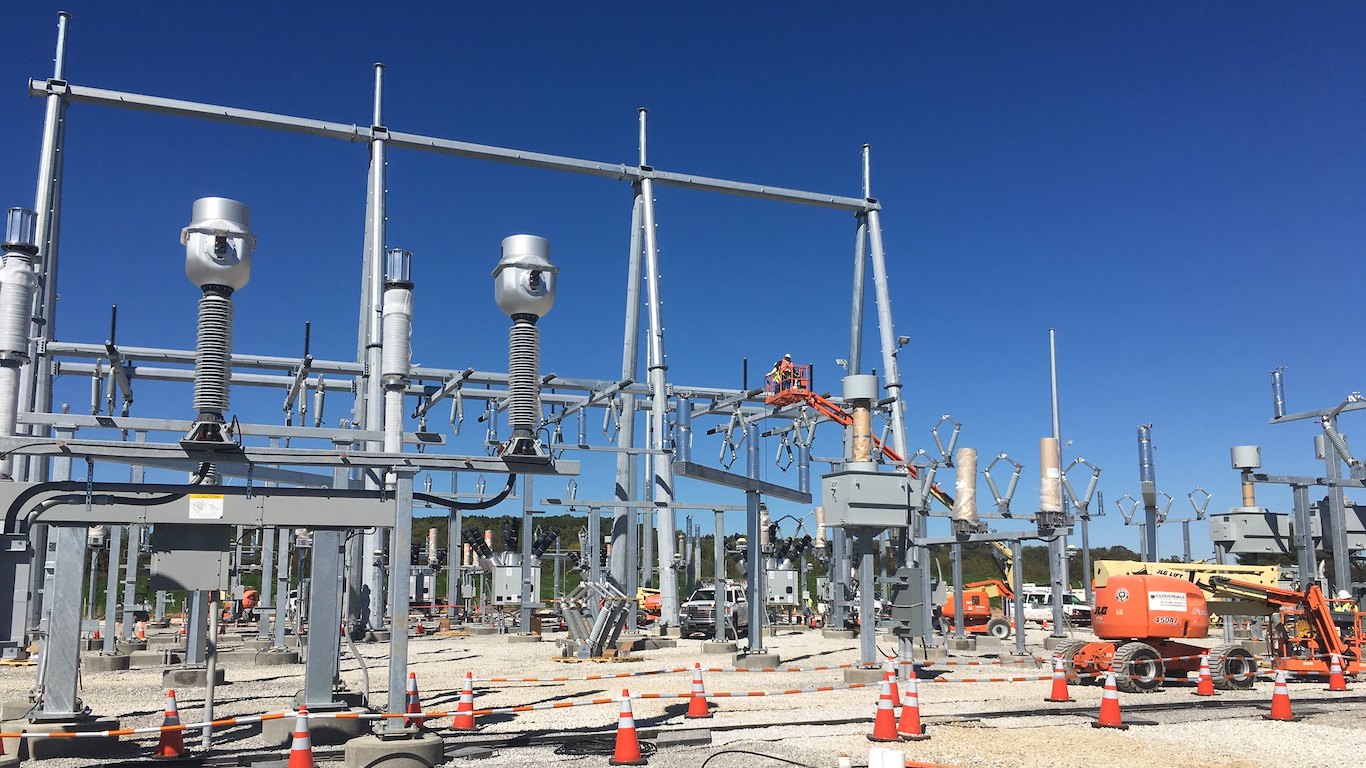
Centuri Holdings (NYSE:CTRI), a Phoenix-based publicly traded utility infrastructure services company, opened 2026 with a statement: more than $870 million in new commercial awards spanning MSA renewals with East Coast utilities, a new gas distribution MSA in the Southwest, and a natural gas storage and compression facility.

The announcement crystallizes the central tension surrounding this infrastructure services company: its backlog is surging, its debt is falling, and its stock has already priced in a lot of good news.

A Backlog Built for Growth

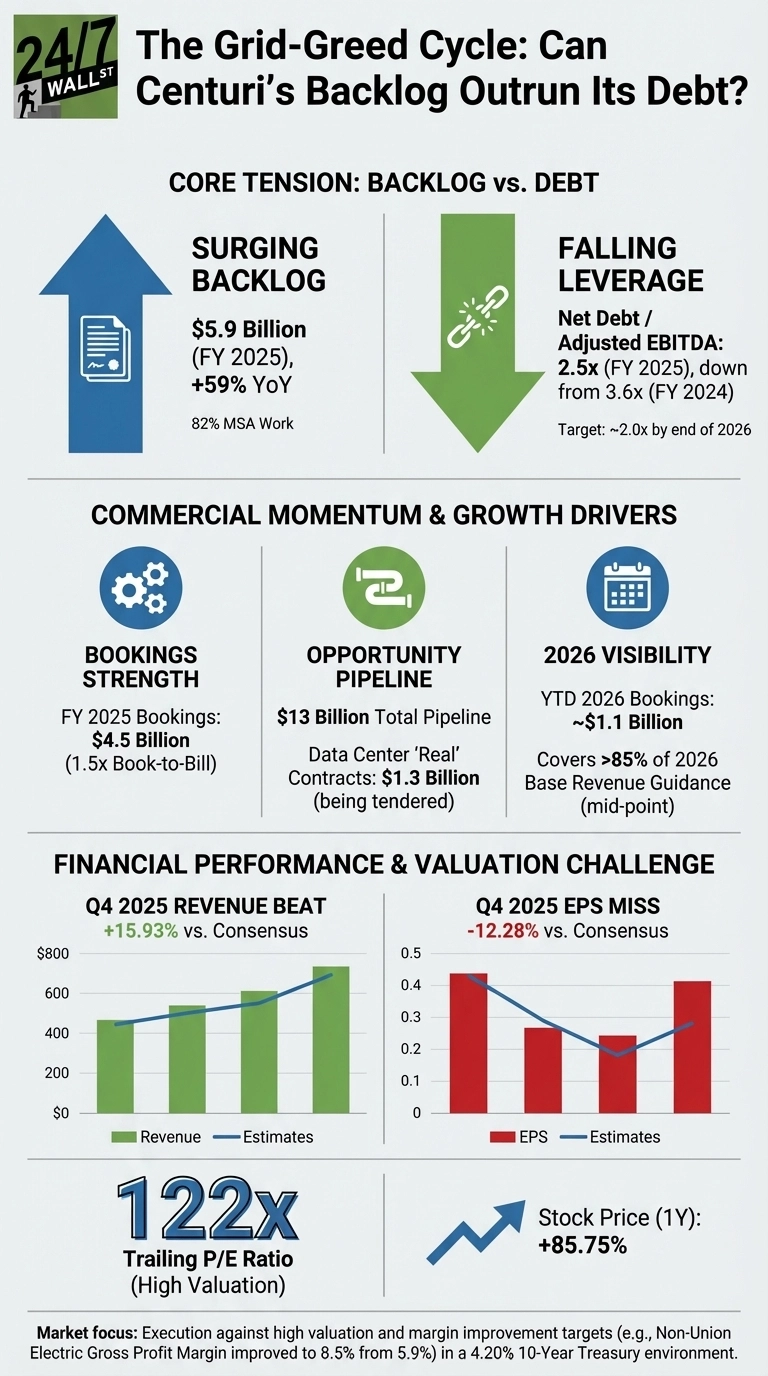
Centuri ended 2025 with a $5.9 billion backlog, up 59% from the prior year, 82% of which was MSA work. For 2026, the company already has approximately $1.1 billion in year-to-date bookings, covering over 85% of the midpoint of its 2026 base revenue guidance. CEO Christian Brown was nothing but direct on the earnings call: “Coming into 2025, we set a goal to achieve a 1.1x book-to-bill ratio. We did not just exceed our goal; we shifted it, delivering a 1.5x book-to-bill for the year. In total, our bookings surpassed $4.5 billion.”

The $13 billion opportunity pipeline includes a data center segment that Brown described with notable specificity: “Of the $2.0 billion, $1.3 billion is real today, where we have got comfort that the client has funding, all the permits are in place, and it is a real contract. We are tendering that $1.3 billion as we speak.”

The Debt Picture Is Improving, But Demands Respect

The leverage story shifted meaningfully in the second half of 2025, and, after a net debt-to-adjusted EBITDA of 3.8x in Q3 2025, the company executed a November 2025 equity offering that raised approximately $251 million in net proceeds, using the bulk of the proceeds to pay down debt.

Centuri CFO Greg Izenstark confirmed the result: “We ended the year with a net debt to adjusted EBITDA ratio of 2.5x, down from 3.6x at year-end 2024. In 2026, we plan to further delever and forecast net debt to adjusted EBITDA of around 2.0x by year-end.”

An infographic from 24/7 Wall St. titled 'The Grid-Greed Cycle: Can Centuri’s Backlog Outrun Its Debt?'. The infographic is structured into three main sections. The first section, 'Core Tension: Backlog vs. Debt', presents two vertical panels. The left panel, 'Surging Backlog', features a large blue upward arrow with a document icon, stating a $5.9 Billion backlog for FY 2025, +59% YoY, with 82% MSA Work. The right panel, 'Falling Leverage', features a large green downward arrow with a broken chain icon, indicating Net Debt / Adjusted EBITDA of 2.5x for FY 2025, down from 3.6x for FY 2024, targeting ~2.0x by end of 2026. The second section, 'Commercial Momentum & Growth Drivers', displays three square panels. 'Bookings Strength' reports FY 2025 Bookings of $4.5 Billion (1.5x Book-to-Bill). 'Opportunity Pipeline' shows a $13 Billion Total Pipeline and Data Center 'Real' Contracts of $1.3 Billion (being tendered). '2026 Visibility' notes YTD 2026 Bookings of ~$1.1 Billion, covering >85% of 2026 Base Revenue Guidance (mid-point). The third section, 'Financial Performance & Valuation Challenge', includes four components. A green bar chart titled 'Q4 2025 Revenue Beat' shows revenue consistently above estimates, with a +15.93% beat vs. Consensus. A red bar chart titled 'Q4 2025 EPS Miss' shows EPS below estimates for Q4, with a -12.28% miss vs. Consensus. A large text display shows '122x Trailing P/E Ratio (High Valuation)'. An upward blue arrow indicates 'Stock Price (1Y): +85.75%'. A final market focus note at the bottom details 'Execution against high valuation and margin improvement targets (e.g., Non-Union Electric Gross Profit Margin improved to 8.5% from 5.9%) in a 4.20% 10-Year Treasury environment.'
24/7 Wall St.
This infographic from 24/7 Wall St. details Centuri Holdings’ (CTRI) financial health, highlighting its surging backlog, falling leverage, and recent quarterly performance.

A Term Loan B repricing in March 2026 secured a 25 basis point rate reduction, and the CFO expects 2026 interest expense to run about 30% lower than 2025. With the 10-year Treasury at 4.20%, the rate environment remains a watchful backdrop for a company still carrying meaningful leverage.

Revenue Beats, Earnings Misses: The Margin Problem

Centuri’s 2025 story was consistent: revenue beat estimates every quarter while adjusted EPS missed every quarter. In Q4, revenue of $858.60 million beat the consensus by 15.93%, yet adjusted EPS of $0.17 missed the ~$0.20 estimate.

Full-year adjusted net income came in at $39 million, a 49% year-over-year increase, but the trailing P/E sits at 122, with a forward P/E of roughly 35x based on 2026 guidance, a multiple that would require a significant earnings ramp to materialize.

Management outlined four margin levers: addressing Q1 gas-seasonality, improving fleet efficiency by at least 20%, driving crew productivity in the fast-growing Non-Union Electric segment, and expanding bid-work margins. Non-Union Electric base gross profit margin already improved to 8.5% from 5.9% in 2024, suggesting the operational work is real, if still early.

A Stock That Has Run Hard

As of March 19, 2026, shares are up 80% over the past year and 20.24% year-to-date, trading near the 52-week high of $32.38. The analyst consensus target of $31.32 implies limited upside from current levels, with ratings split between 4 buys and 2 strong sells. The backlog is real, the deleveraging is real, and end-market tailwinds from grid modernization and data center power demand are real. Whether the current valuation leaves enough margin for inevitable execution bumps is the question the market is still working through.

Photo of David Beren
About the Author David Beren →

David Beren has been a Flywheel Publishing contributor since 2022. Writing for 24/7 Wall St. since 2023, David loves to write about topics of all shapes and sizes. As a technology expert, David focuses heavily on consumer electronics brands, automobiles, and general technology. He has previously written for LifeWire, formerly About.com. As a part-time freelance writer, David’s “day job” has been working on and leading social media for multiple Fortune 100 brands. David loves the flexibility of this field and its ability to reach customers exactly where they like to spend their time. Additionally, David previously published his own blog, TmoNews.com, which reached 3 million readers in its first year. In addition to freelance and social media work, David loves to spend time with his family and children and relive the glory days of video game consoles by playing any retro game console he can get his hands on.

Featured Reads

Our top personal finance-related articles today. Your wallet will thank you later.

Continue Reading

Top Gaining Stocks

CBOE Vol: 1,568,143
PSKY Vol: 12,285,993
STX Vol: 7,378,346
ORCL Vol: 26,317,675
DDOG Vol: 6,247,779

Top Losing Stocks

LKQ
LKQ Vol: 4,367,433
CLX Vol: 13,260,523
SYK Vol: 4,519,455
MHK Vol: 1,859,865
AMGN Vol: 3,818,618