Walmart (NYSE:WMT | WMT Price Prediction) trades at $123.50 as of writing and our price target for the next 12 months is $130.57, representing roughly 5.7% upside. With 91% of analysts rated bullish and a consensus target of $136.02, our model sits modestly below the Street but aligned directionally. The model carries a confidence level of 90%.
| Metric | Value |
|---|---|
| Current Price | $123.50 |
| 24/7 Wall St. Price Target | $130.57 |
| Upside | ~5.7% |
| Recommendation | Bullish |
| Confidence Level | 90% |
The target reflects a well-run retailer executing across eCommerce, advertising, and international markets. Measured upside is appropriate for a ~$980 billion market cap consumer staple trading at 45x trailing earnings.
A Strong Year in the Rearview Mirror
Walmart shares have gained 46.33% over the past year and are up 11.08% year-to-date through March 30, 2026. The stock pulled back 3.28% over the past month but recovered 2.3% in the most recent week. The 52-week range spans $79.11 to $134.41, with the stock sitting about 1% below that high.
Q4 FY26 results reinforced the bull case. Adjusted EPS came in at $0.74, beating the $0.70 consensus by 5.71%. Revenue of $190.66 billion beat estimates by 3.59% and grew 5.6% year-over-year. For the full fiscal year, revenue reached $713.163 billion and net income grew 12.64% to $21.893 billion. Quarterly net income fell 19.36% year-over-year, though this reflects one-time items rather than structural deterioration.

Why Bulls See More Room to Run
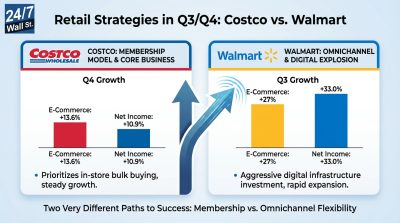
Walmart’s eCommerce business anchors the bull case. Global eCommerce grew 24% in the fourth-quarter, marking seven consecutive quarters of growth above 20%. eCommerce now represents 23% of Walmart U.S. net sales, a record high, and the economics are improving: Q4 incremental e-commerce margins reached 11% versus the overall enterprise margin of 7%.
The advertising business adds another high-margin growth layer. Full-year global advertising revenue reached nearly $6.40 billion, growing 37% in Q4 including VIZIO. Membership income grew 15.1% globally. The bull case 2030 target is $189.75, implying 57.04% total return if higher-margin businesses continue scaling.
Risks Worth Watching
Valuation is the primary risk. At 45x trailing earnings and 40x forward earnings, Walmart prices in significant execution. A slowdown in eCommerce or advertising growth could compress the multiple. Tariff and trade policy uncertainty also looms: management withheld specific guidance in Q2 FY26 because of it.
The quarterly net income decline of 19.36% year-over-year in Q4 looks alarming in isolation, but Q2 FY26 alone included $440 million in discrete legal charges and $150 million in reorganization costs. Full-year net income grew 12.64%, confirming the quarter-level pressure was largely non-recurring. The bear case 2030 scenario prices WMT at $120.33, requiring multiple compression and sustained macro headwinds.

What the Model Signals for Investors
The 24/7 Wall St. price target of $130.57 reflects high conviction in Walmart’s near-term trajectory. CEO John Furner captured the moment: “The pace of change in retail is accelerating. It’s exciting. And our financial results show that we’re not only embracing this change, we’re leading it.”
The eCommerce trajectory, advertising scale, and FY27 adjusted EPS guidance of $2.75 to $2.85 underpin the model’s positive outlook. Tariff escalation that disrupts supply chains or multiple compression on slowing growth represent the key downside risks to monitor.
Walmart Price Prediction 2026 to 2030
Based on continued eCommerce scaling, advertising growth, and steady margin expansion, here is where the 24/7 Wall St. model projects Walmart through 2030.
| Year | 24/7 Wall St. Price Target (Base) | Bull Case | Bear Case |
|---|---|---|---|
| 2026 | $128.48 | $136.64 | $116.00 |
| 2027 | $136.81 | $154.04 | $114.09 |
| 2028 | $143.13 | $168.64 | $113.87 |
| 2029 | $152.19 | $179.89 | $115.86 |
| 2030 | $160.14 | $189.75 | $120.33 |
These projections assume Walmart continues executing on its omnichannel strategy, with advertising and membership revenues compounding at above-average rates. Tariff escalation, a U.S. consumer recession, or an acceleration in eCommerce margin improvement could drive significant variance in either direction.