Walmart (NASDAQ:WMT | WMT Price Prediction) reported a strong fourth quarter, capping a year defined by digital acceleration and advertising growth. Costco (NASDAQ:COST) followed in early March with results that reinforced its membership flywheel. Both are winning in the same consumer environment. The question is which model holds more upside.
Two Very Different Machines Firing at the Same Time
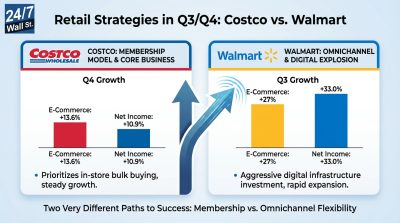
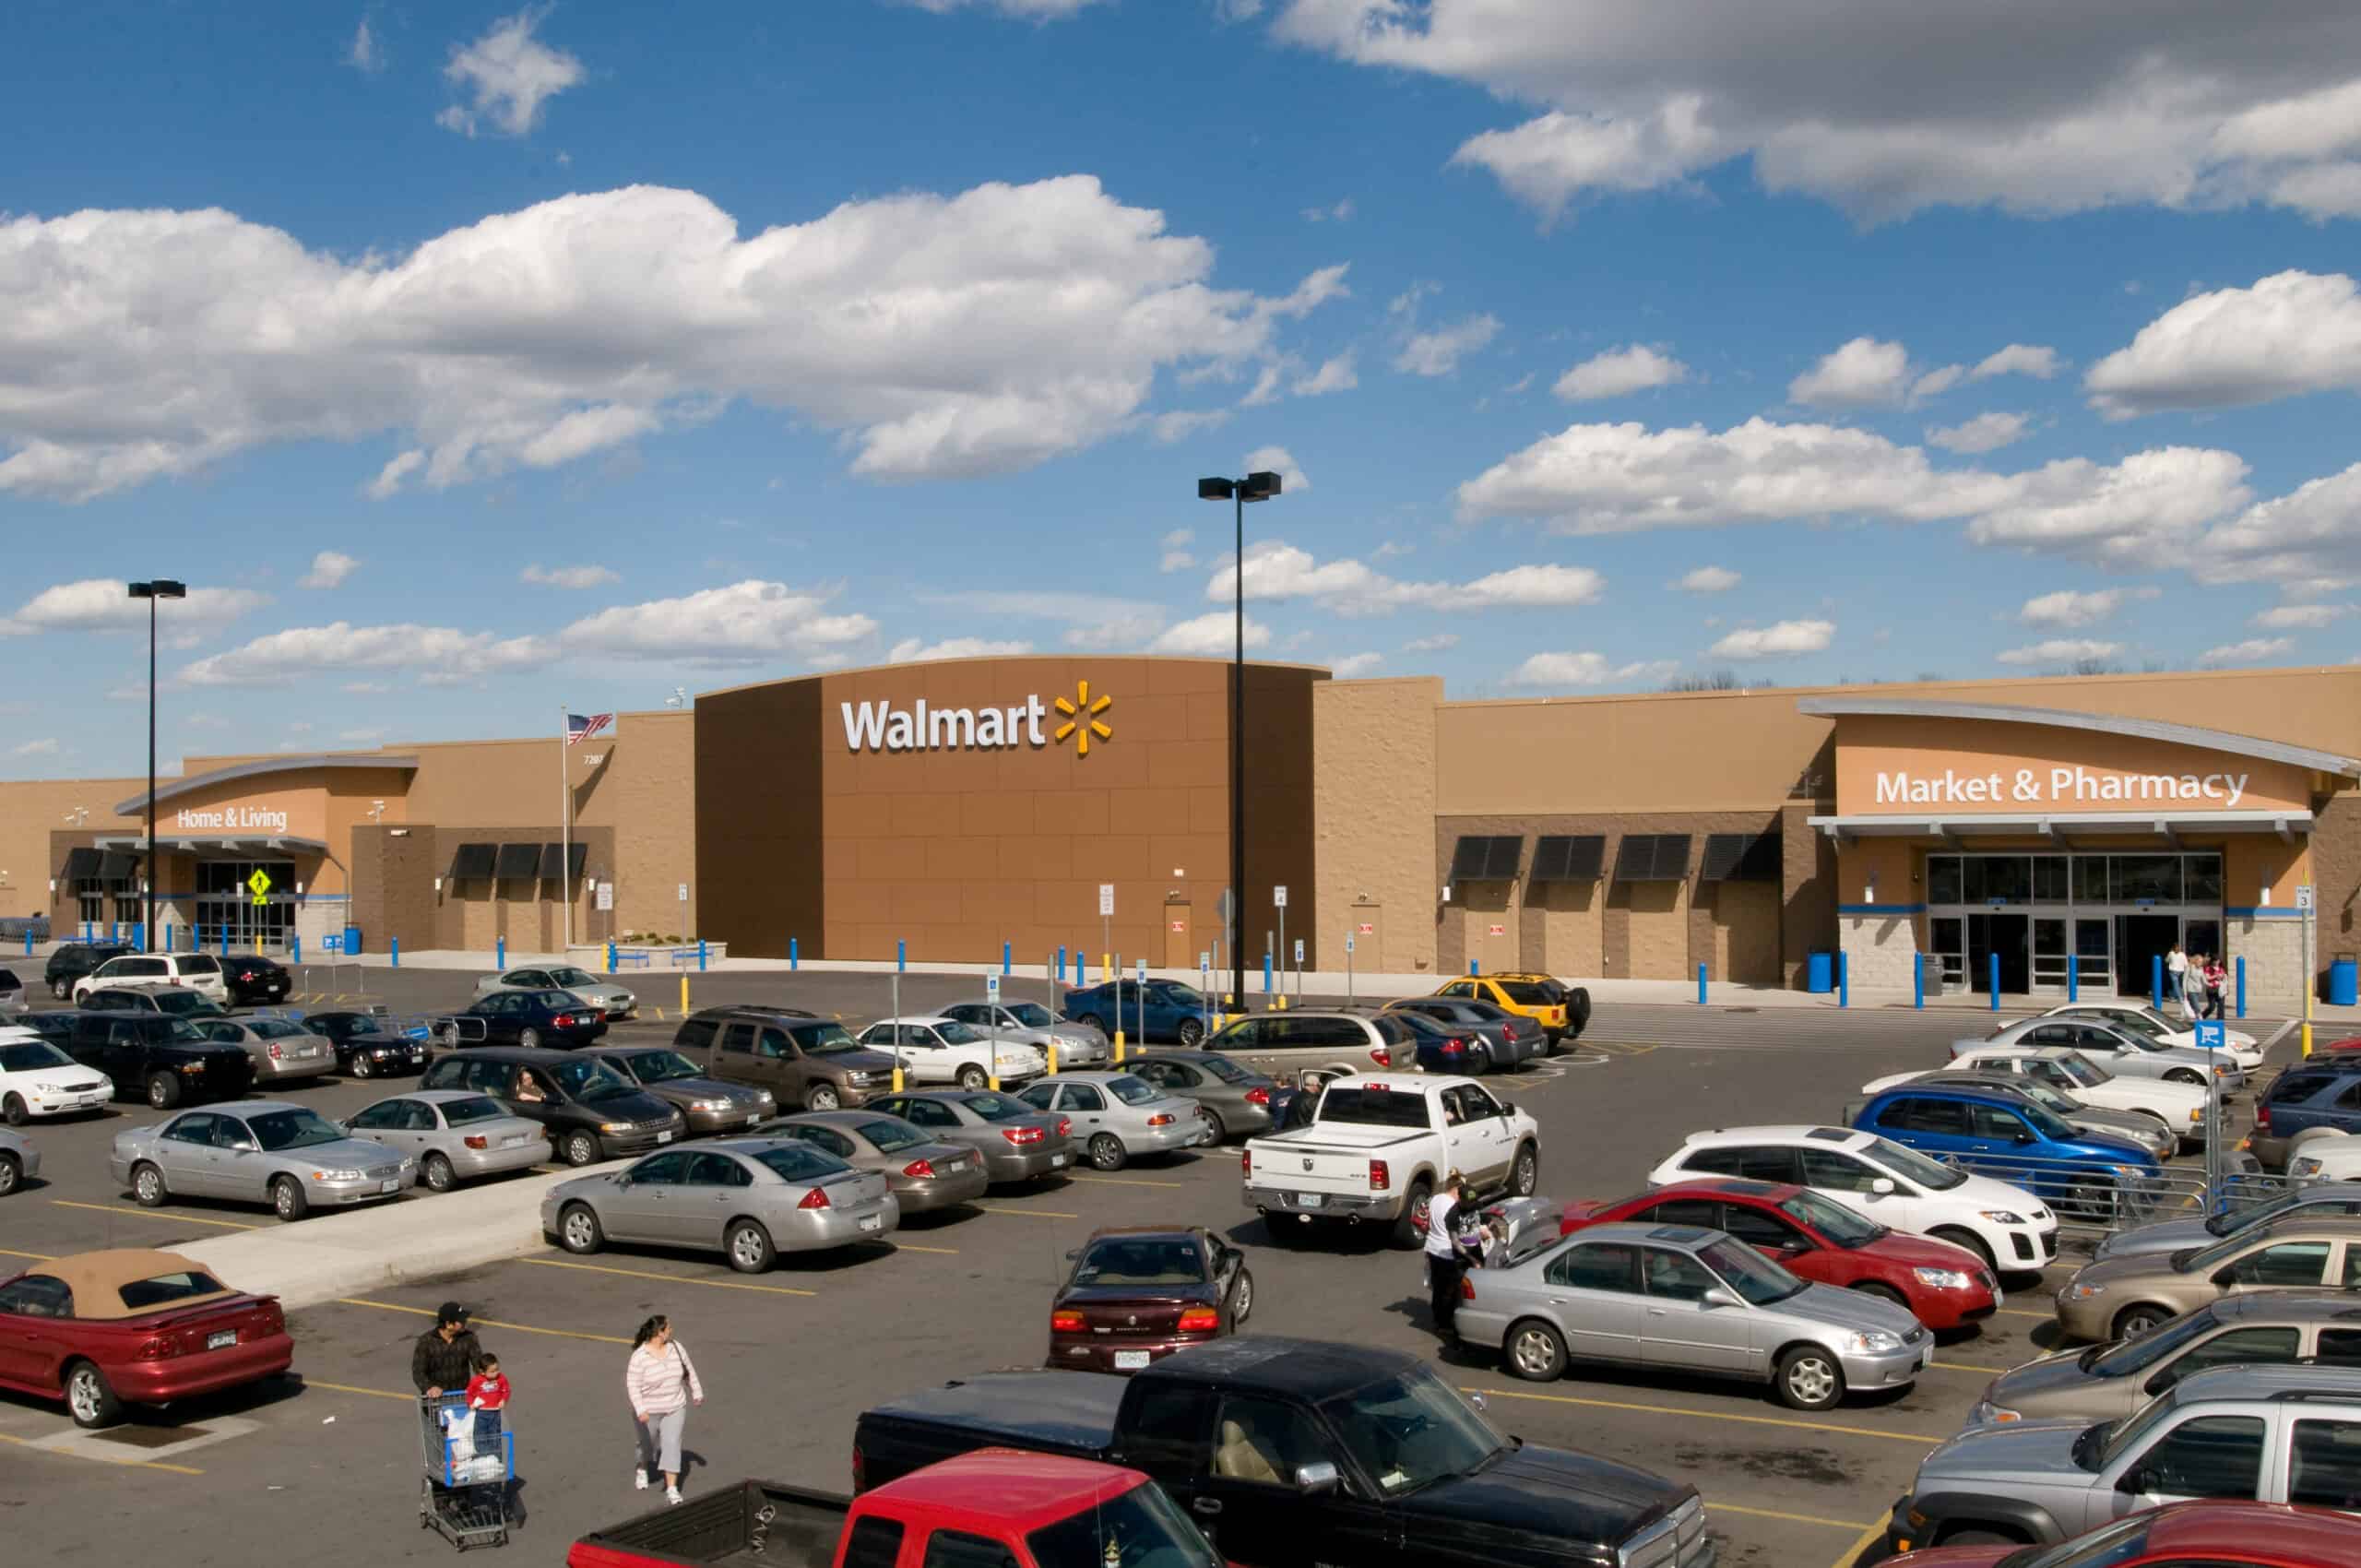
Walmart’s Q4 showed a business that has genuinely evolved. Global eCommerce grew 24%, with Walmart U.S. eCommerce up 27%, and store-fulfilled expedited delivery surged more than 50%. The advertising segment was the real standout: global advertising revenue grew 37%, with the full-year business reaching nearly $6.40 billion. That is a high-margin revenue stream most retailers cannot replicate.
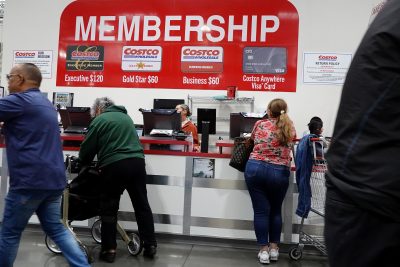
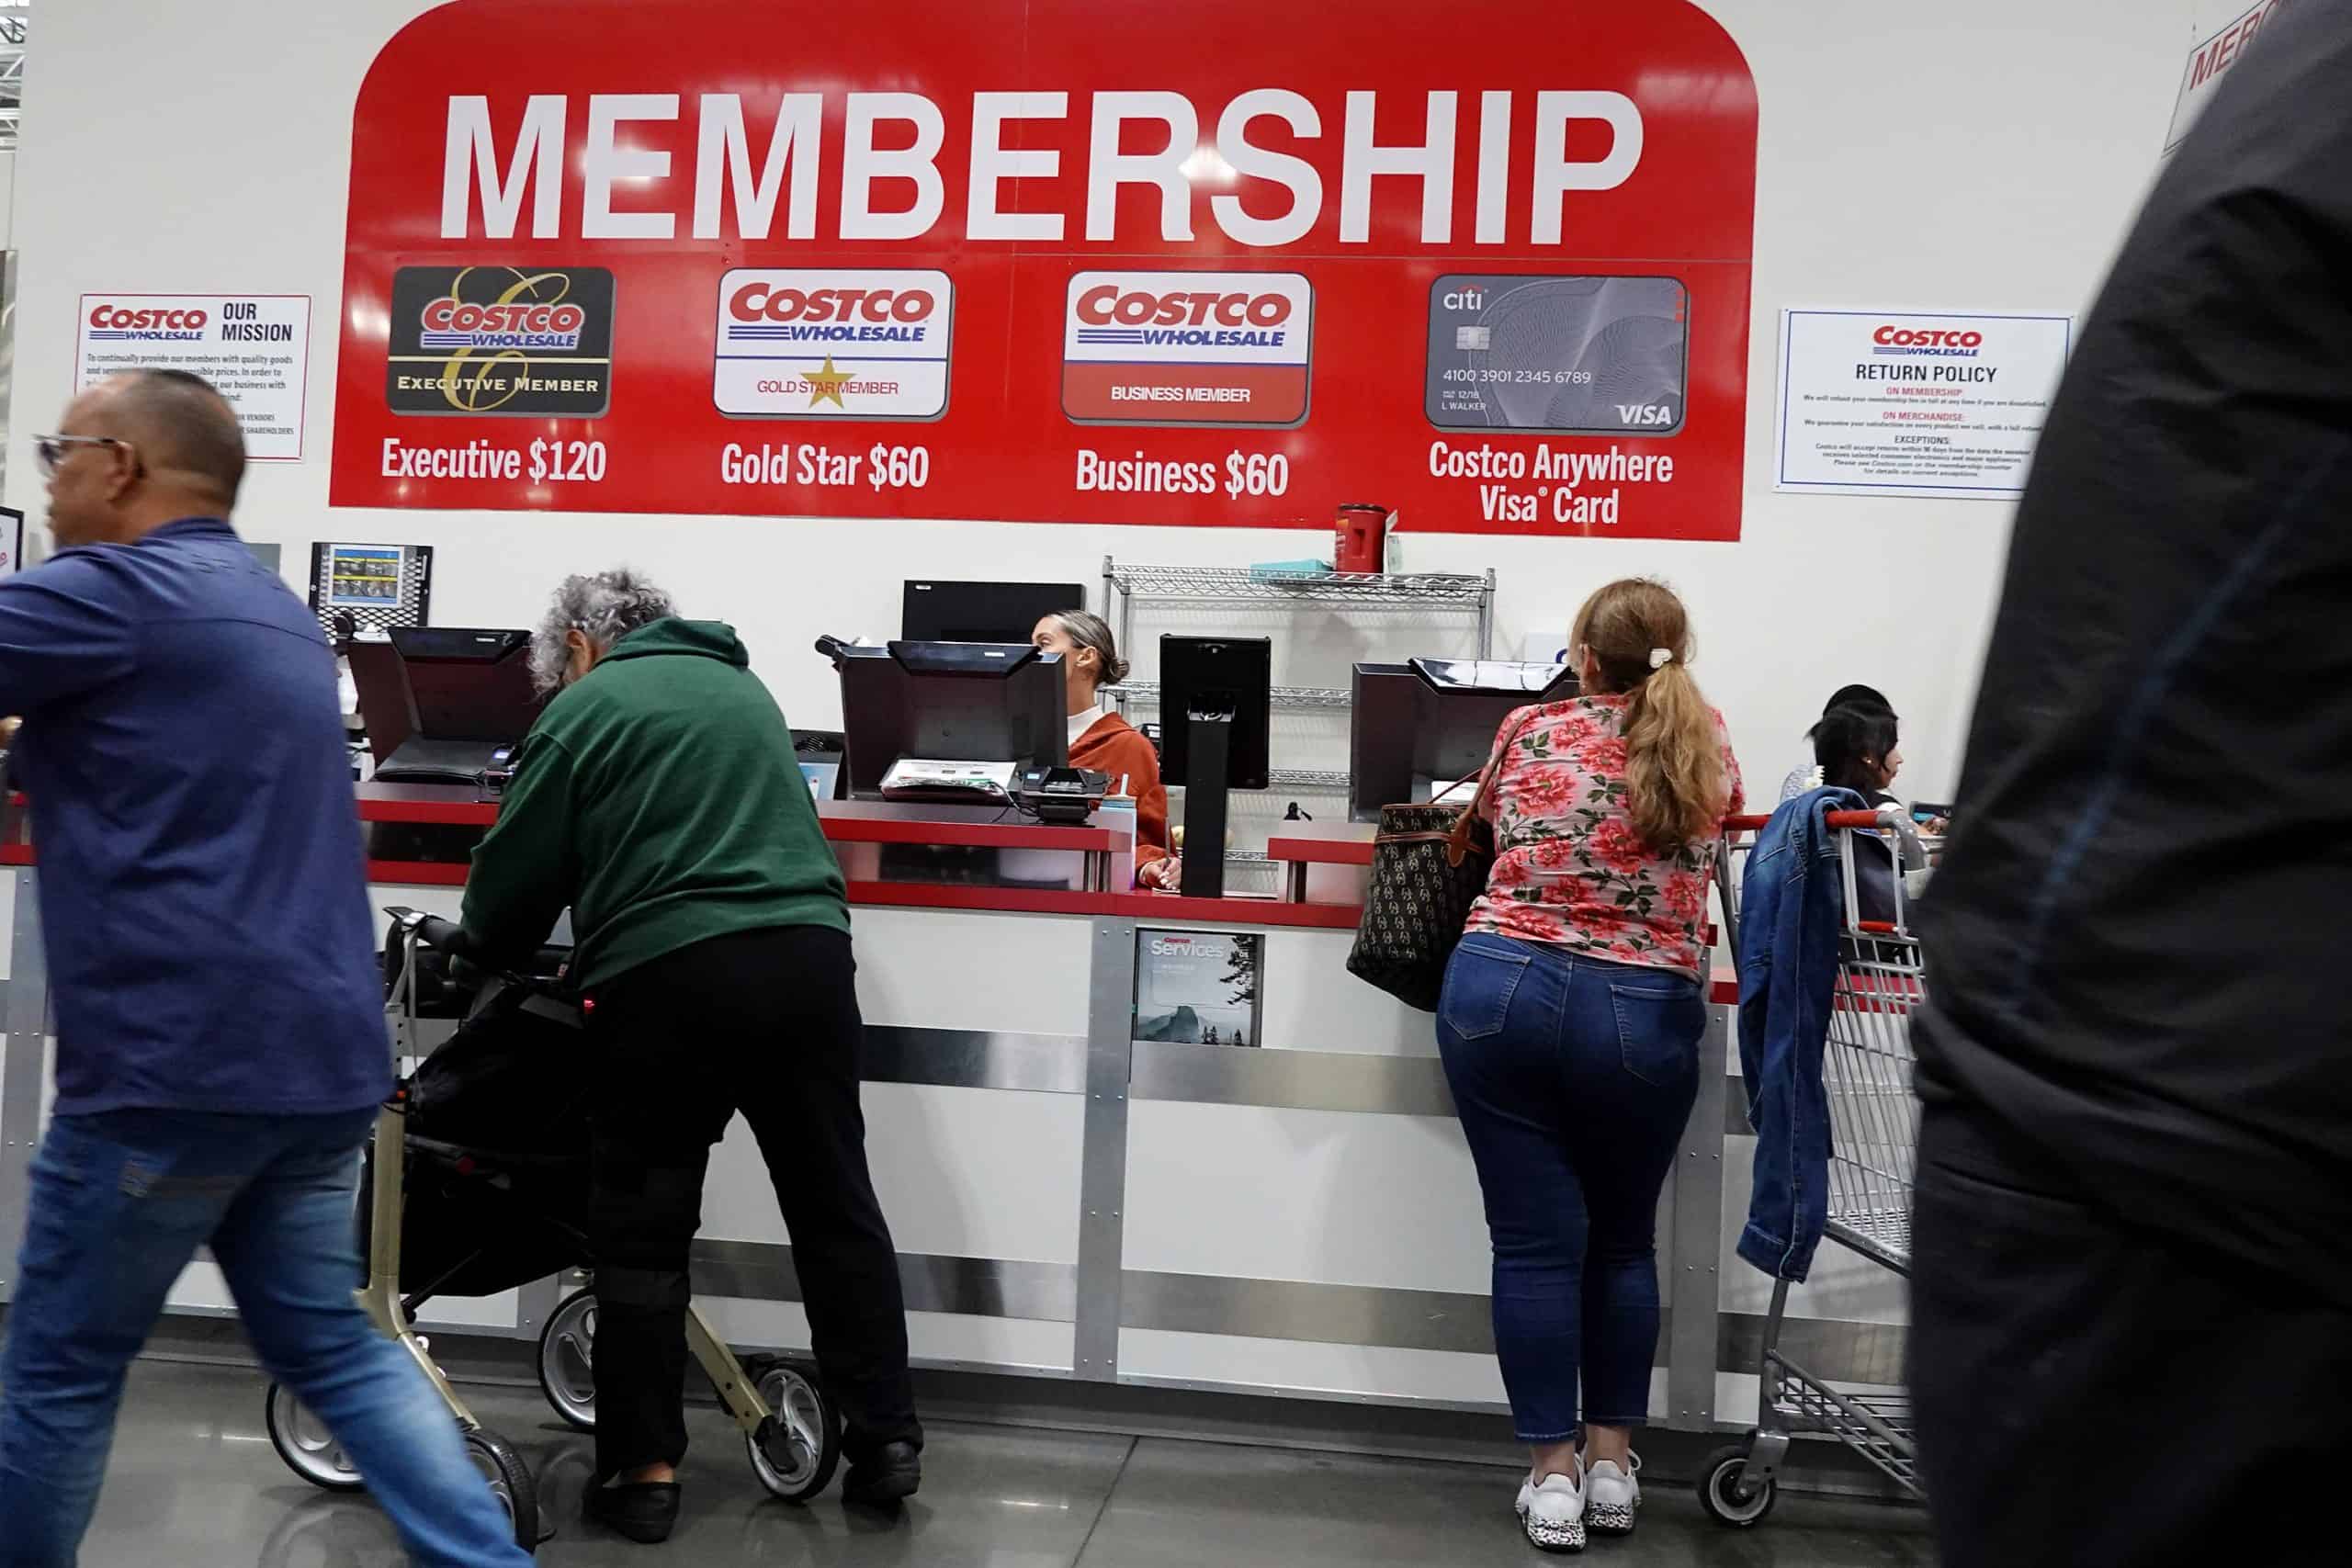
Costco’s story is quieter but equally compelling. Comparable sales grew 7.4%, with traffic up 3.1% globally. The membership engine kept humming: fee income rose 13.6% to $1.35 billion, paid memberships reached 82.1 million, and the worldwide renewal rate held at 89.7%. Kirkland Signature absorbed tariff pressure through supplier negotiations rather than price increases, deepening member loyalty without sacrificing volume.
| Business Driver | Walmart | Costco |
|---|---|---|
| Main Growth Engine | eCommerce + advertising | Membership flywheel + Kirkland |
| eCommerce Growth | +27% (U.S.) | +22.6% digitally-enabled |
| Gross Margin | 24.0% | 11.02% |
| Membership Fee Growth | +15.1% globally | +13.6% |
Retail Media Empire vs. the Loyalty Lock-In
Walmart’s strategic edge increasingly lives above the store level. The VIZIO acquisition expanded connected TV advertising reach, and Walmart Connect U.S. grew 41%.
About 50% of eCommerce fulfillment center volume is now automated, compressing costs as volume scales. The company also gained share across all income tiers, with upper-income households leading the shift, signaling the brand has moved beyond its price-sensitive roots.
Costco’s moat runs through its members. Executive membership penetration reached 75.8% of sales, and app visits jumped 63% while e-commerce average order value rose 15%.
Personalization carousels drove over $470 million in e-commerce sales in Q2. The warehouse expansion plan targets approximately 28 net new locations in FY2026, a measured pace that keeps the treasure-hunt experience intact.
| Strategic Lens | Walmart | Costco |
|---|---|---|
| Valuation (Trailing P/E) | 45x | 51x |
| YTD Stock Performance | +11.08% | +15.73% |
| One-Year Return | +46.33% | +7.79% |
| Key Vulnerability | Tariff exposure, FX | Premium valuation, thin margins |
The Valuation Gap Is the Real Decision
Costco trades at forward P/E of 48x, while Walmart sits at 40x forward earnings. Neither is cheap. Walmart’s advertising business provides a margin expansion path Costco’s model structurally cannot match. Costco’s intentionally thin 11.02% gross margin limits the levers management can pull when costs rise.
The next test for Costco is whether its tariff absorption strategy holds through FY2026. Shifting sourcing and consolidating global buying are smart moves, but supplier cooperation is not guaranteed. For Walmart, the question is whether advertising revenue can sustain growth while the core business navigates FY27 guidance of adjusted EPS of $2.75 to $2.85.
Why Walmart Has the Edge for This Moment
Both businesses are executing well. Walmart’s scale, digital momentum, and differentiated advertising revenue give it more ways to grow earnings faster than retail peers.
Costco’s loyalty metrics are extraordinary and its membership model is nearly impossible to replicate, but at 51x trailing earnings, the stock prices in significant future perfection.
Walmart’s 46.33% one-year return reflects strong momentum, yet its forward multiple still sits below Costco’s. Walmart’s margin expansion path and multiple business levers give it more ways to grow earnings faster than retail peers.
Costco’s renewal rate and Kirkland loyalty metrics remain extraordinary for long-term oriented investors tracking the membership model. Costco’s valuation at this level leaves limited room for error if growth slows.