Public BDCs are now trading at a roughly 21% discount to net asset value, and VanEck BDC Income ETF (NYSEARCA:BIZD) has shed about 8% year to date even as it raised its quarterly payout. The gap between rising distributions and falling prices is the central tension income investors face with this fund.
How BIZD Generates Its Income
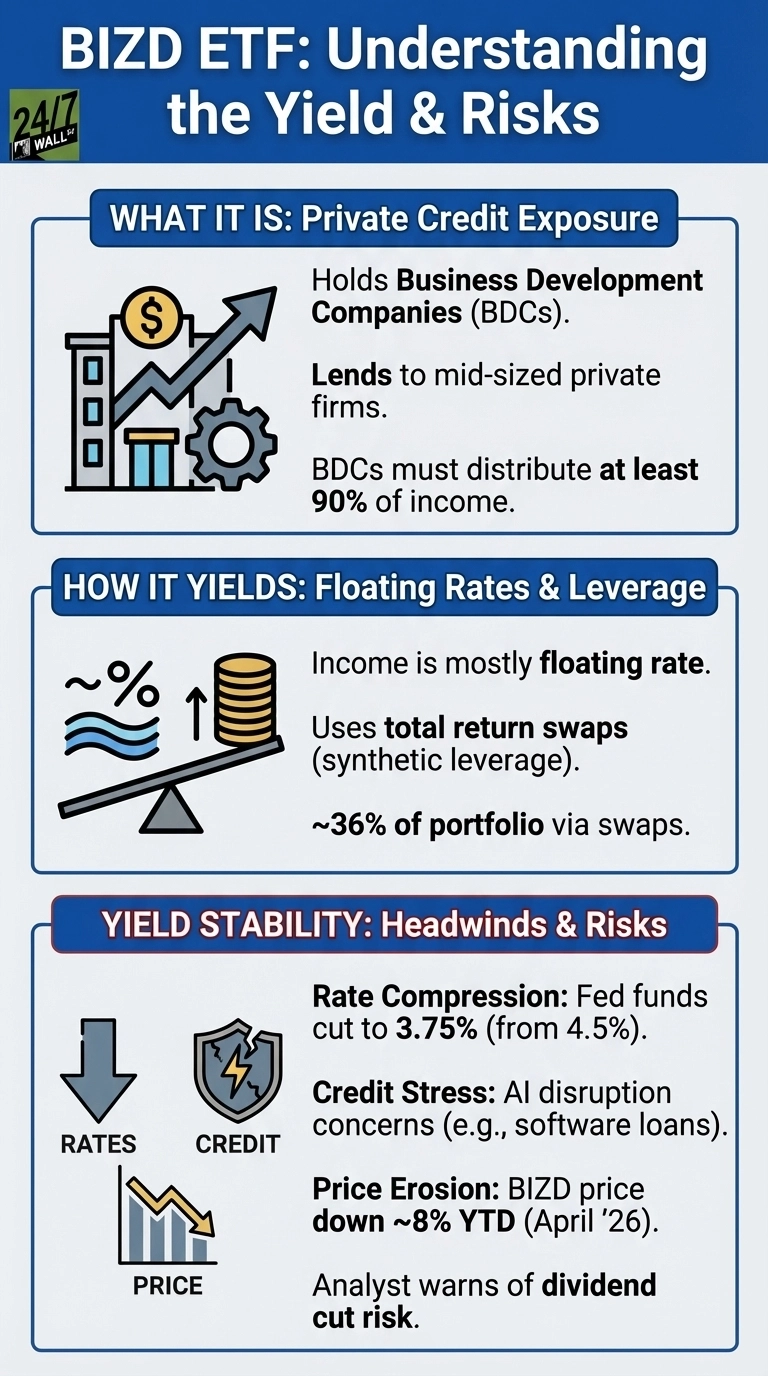
BIZD holds shares in Business Development Companies, specialty lenders that extend credit to mid-sized private companies too small for traditional bank financing. By law (Investment Company Act of 1940), BDCs must distribute at least 90% of their taxable income. Roughly 36% of the portfolio is held through total return swaps rather than direct equity positions, a synthetic structure that amplifies both income and downside exposure. The fund’s reported net expense ratio is about 13 basis points, but the swap structure embeds additional financing costs via SOFR-plus spreads that are not reflected in that headline figure.
The yield question is complicated by measurement. A trailing twelve-month calculation produced a yield of 12.66% as of February 2026, while the most recent reported yield stood at 9.3% as of early April 2026. The 14% figure reflects a period when the Fed funds rate was higher, and BDC loan yields had not compressed to current levels.
The Rate Compression Problem
BDC income is almost entirely floating rate, rising and falling with benchmark rates. The Federal Reserve cut rates three times between October and December 2025, bringing the fed funds rate to 3.75% from 4.5%. That 75 basis point reduction flows directly into BDC loan portfolios.
At Ares Capital (NASDAQ:ARCC | ARCC Price Prediction), BIZD’s largest named holding at 13% of the portfolio (outside of the treasury bills the ETF holds), the weighted average yield on debt securities has compressed. New commitments are coming in at 9.1%, down from 11.1% a year ago. Coverage remains adequate, as Ares Capital generated $0.52 per share of net investment income in Q4 2025 against a $0.48 quarterly dividend, a margin that has held steady for four consecutive quarters even as yields have compressed. Net realized losses jumped to $155 million in Q4 2025 from $29 million in Q4 2024, signaling credit stress building beneath headline coverage numbers.
Blue Owl Capital Corporation (NYSE:OBDC), BIZD’s second-largest named holding at just over 8% of the portfolio, presents a more cautious picture. Adjusted net investment income per share came in at $0.36 in Q4 2025, missing the $0.37 consensus estimate, as lower base rates compressed returns on its 96.4% floating-rate portfolio. NAV per share drifted from $15.14 to $14.81 over the past year.
Main Street Capital (NYSE:MAIN), at just under 7% of BIZD’s portfolio, is the outlier. Distributable net investment income reached $1.09 per share in Q4 2025 against a $0.26 monthly dividend, and the company raised its monthly payment 11 times since Q4 2021. Main Street’s equity co-investment model in lower middle-market companies provides income diversification that pure lenders lack.
The Private Credit Liquidity Question
Analysts have warned that AI disruption could weaken the credit quality of BDC loans to software and technology borrowers. Sector averages sit near 20 percent software exposure, but some portfolios run higher, and Blue Owl’s tech‑focused private credit vehicles illustrate how concentrated certain lenders can become. Non‑traded BDCs add another layer of risk because redemption pressure can force asset sales into illiquid markets.
Market signals have firmed but not flashed a crisis. The VIX jumped to 31 in late March 2026 before settling near 19, and the 10‑year minus 2‑year Treasury spread has narrowed from 0.74 percent in February to about 0.50 percent, placing it near the lower end of its 12‑month range. Neither measure indicates immediate stress, but both suggest tighter financial conditions that could strain BDC borrowers.
Price Erosion Has Offset a Portion of Distributed Income
BIZD is down about 8% year to date and has declined roughly 4% over the past year, meaning income received has been partially offset by price erosion. A Seeking Alpha analyst concluded in December 2025 that BIZD has consistently distributed more than it earns and that over 50% of its AUM carries a significant risk of a dividend cut. The fund’s synthetic leverage amplifies vulnerability if private credit spreads widen sharply.
Ares Capital’s coverage has held steady, and Main Street Capital’s income stream has remained consistent, though both face the same directional pressures. Each Fed rate cut, each credit impairment, and each quarter of NAV erosion narrows the coverage margin. The fund’s income profile is cyclical, tied to floating rates and credit quality across its underlying holdings. The yield differential relative to investment-grade bonds reflects the credit and liquidity risk embedded in the underlying BDC portfolios.