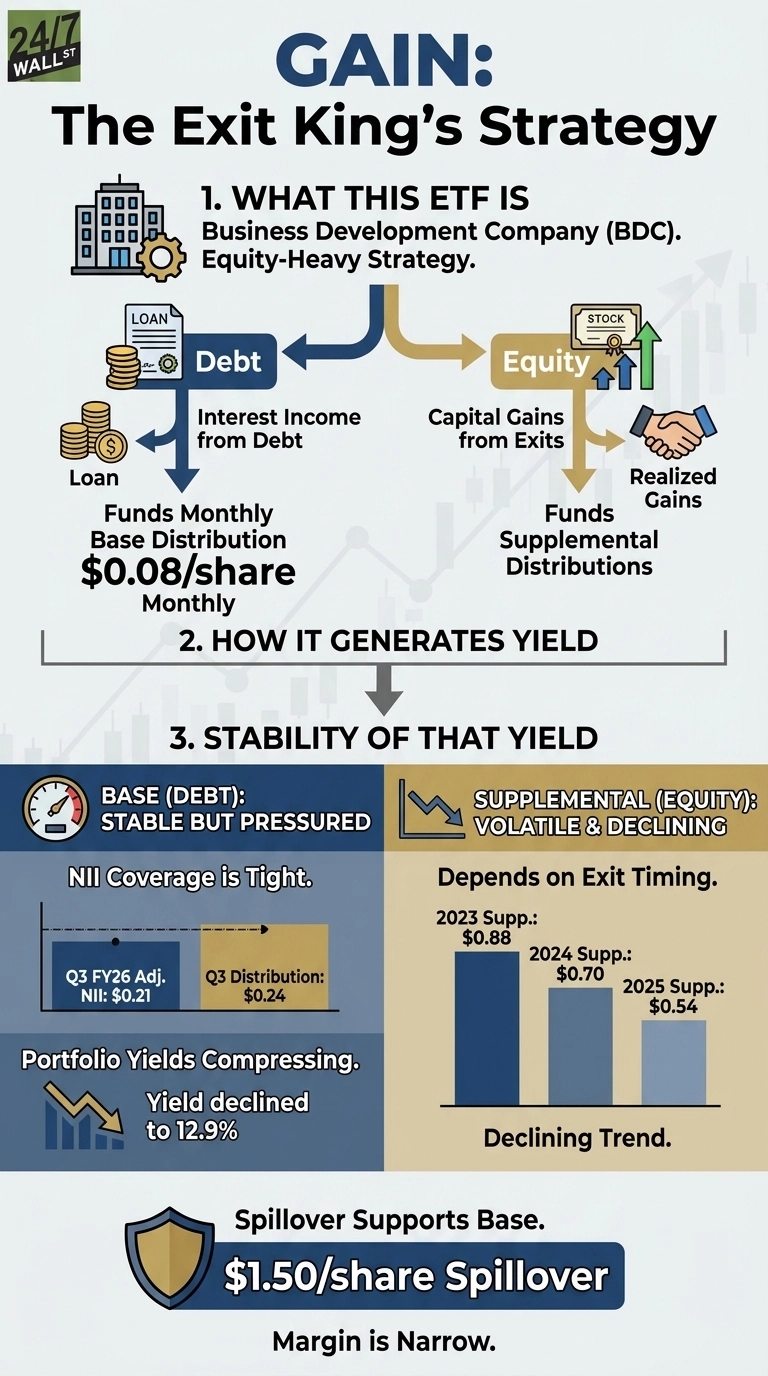
Gladstone Investment Corporation (NASDAQ:GAIN) operates an unusual BDC model. Most business development companies generate income from interest on debt loans to private companies. GAIN layers an equity buyout strategy on top, taking ownership stakes in lower-middle-market businesses and realizing capital gains when those companies are sold. This produces two income streams: a steady monthly base distribution funded by net investment income (NII) from debt, and periodic supplemental distributions funded by realized gains from equity exits.
Shares have climbed 14% over the past year and are up 14% year-to-date, recently trading near $15.94. That price now sits above the most recent NAV per share of $14.95, a reversal of prior-quarter discounts.
Two Streams, Two Different Risk Profiles
The base monthly distribution of $0.08 per share, when annualized, is $1.50 per share and is funded by NII. Supplemental distributions, which have totaled $0.54 in 2025, $0.70 in 2024, and $0.88 in December 2023, depend entirely on portfolio company sales at a gain. The declining trend reflects fewer large exits, meaning total annual income from GAIN has been shrinking.
CEO David Gladstone stated on the fiscal year 2025 earnings call: “We’re not really in that giant buyout game, which seems to be stalled due to a lack of exits in the public marketplace. Others have investments in large buyouts that aren’t liquid, but we typically sell what we put up for sale quickly.” Since its inception through March 2025, GAIN has invested in 62 buyout portfolio companies and generated approximately $353 million in net realized gains.
The Base Distribution Faces Pressure
Net investment income coverage remains the key measure of dividend stability, and recent results show that coverage has tightened. Reported NII has softened over the past several quarters, and while the base distribution has been maintained, the most recent period did not fully cover the payout on an adjusted basis. GAAP results were also affected by non‑cash incentive‑fee accruals, which reduce reported income even though the associated fees are not yet payable.
These accruals do not draw cash in the quarter but do represent real economic cost. Total investment income has also come under pressure, reflecting a more challenging yield environment across the portfolio.
Portfolio yields have compressed as well. Weighted‑average yields on interest‑earning assets have declined over recent quarters, consistent with broader trends across the BDC sector. With a meaningful portion of the portfolio at or near interest‑rate floors, further Fed cuts would primarily affect the remaining floating‑rate exposure rather than the entire book. While the retrieved data did not provide a current Fed Funds rate, the broader backdrop of moderating short‑term rates continues to influence portfolio yields, earnings power, and dividend coverage.
Balance Sheet and Spillover Support
Management noted that the company ended the fiscal year with meaningful spillover income, providing coverage for the current monthly distribution and the recently declared supplemental payout. The asset‑coverage ratio remains comfortably above the 150% regulatory minimum, and the company has expanded its credit capacity, giving it additional flexibility even as NII coverage has tightened. These balance‑sheet buffers provide a runway should earnings remain under pressure.
NAV per share improved in the most recent quarter, supported by net unrealized appreciation across the portfolio. That recovery reflects genuine mark‑to‑market gains, but unrealized appreciation does not generate cash and therefore cannot directly fund distributions. Dividend sustainability continues to depend on recurring net investment income rather than valuation movements.
Base Distribution Is Defensible, but the Margin Is Narrow
The base monthly distribution sits near the edge of coverage. Net investment income has tightened over recent quarters, and the most recent period did not fully cover the payout on an adjusted basis. Portfolio yields have also compressed and have yet to show a sustained recovery. Supplemental distributions have trended lower and remain dependent on realized gains, which are inherently tied to exit timing and therefore outside management’s control.
The base payout appears defensible given the company’s spillover income and balance‑sheet flexibility, but the margin is narrow. The overall structure aligns with how most BDCs balance stable base dividends with variable supplemental payouts.