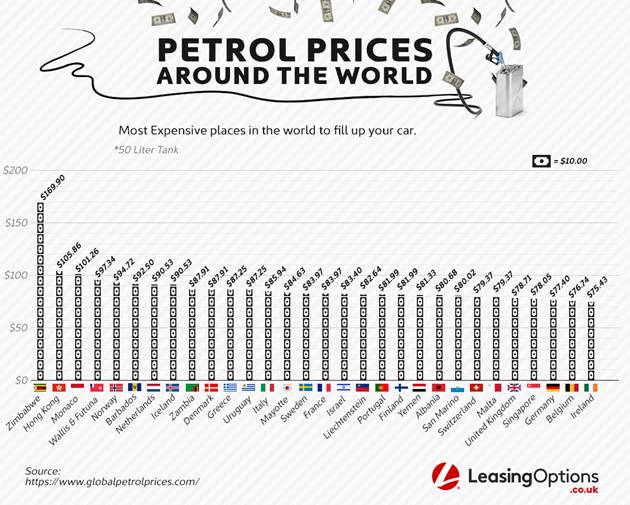
American drivers filling up in Texas are paying $2.31 to $2.39 per gallon while Hong Kong motorists pay $11.62. That gap reflects four structural forces pulling in opposite directions.
The Four Drivers
Crude costs dominate, representing roughly 51% to 52% of the U.S. retail price. When the Strait of Hormuz disrupted roughly one-fifth of global oil and LNG flows during the 2026 Iran conflict, Asian physical crude surged toward $150 per barrel while WTI held near $100.72, insulated by U.S. shale output and Canadian and Mexican imports.
Refining margins add another layer. U.S. Gulf Coast crack spreads ran $20 to $25 per barrel in early 2026, nearly double historical norms, while European refiners absorbed elevated natural gas costs. Henry Hub natural gas was trading at $2.79 per MMBtu in mid-April 2026.
Taxes are the single biggest differentiator globally. The U.S. total tax burden runs roughly 52 cents per gallon. The Netherlands charges the equivalent of $3.46 per gallon in excise alone, plus 21% VAT. Across Europe, taxes represent up to 60% of the final retail price.
Carbon policy widens the gap further. The EU’s ETS2 program launches in 2027, adding permanent upward pressure on European pump prices. The U.S. has no equivalent federal carbon pricing mechanism.
What Investors Should Watch
The U.S. national average rose to $3.58 per gallon at peak shock, modest compared to 50% spikes in the Philippines and Nigeria. That resilience reinforces the structural advantage U.S. refiners hold, with windfall margins on cheap domestic crude. The EIA forecasts U.S. production reaching 13.9 million barrels per day by 2027, suggesting the gap with Asia and Europe is likely to persist.