
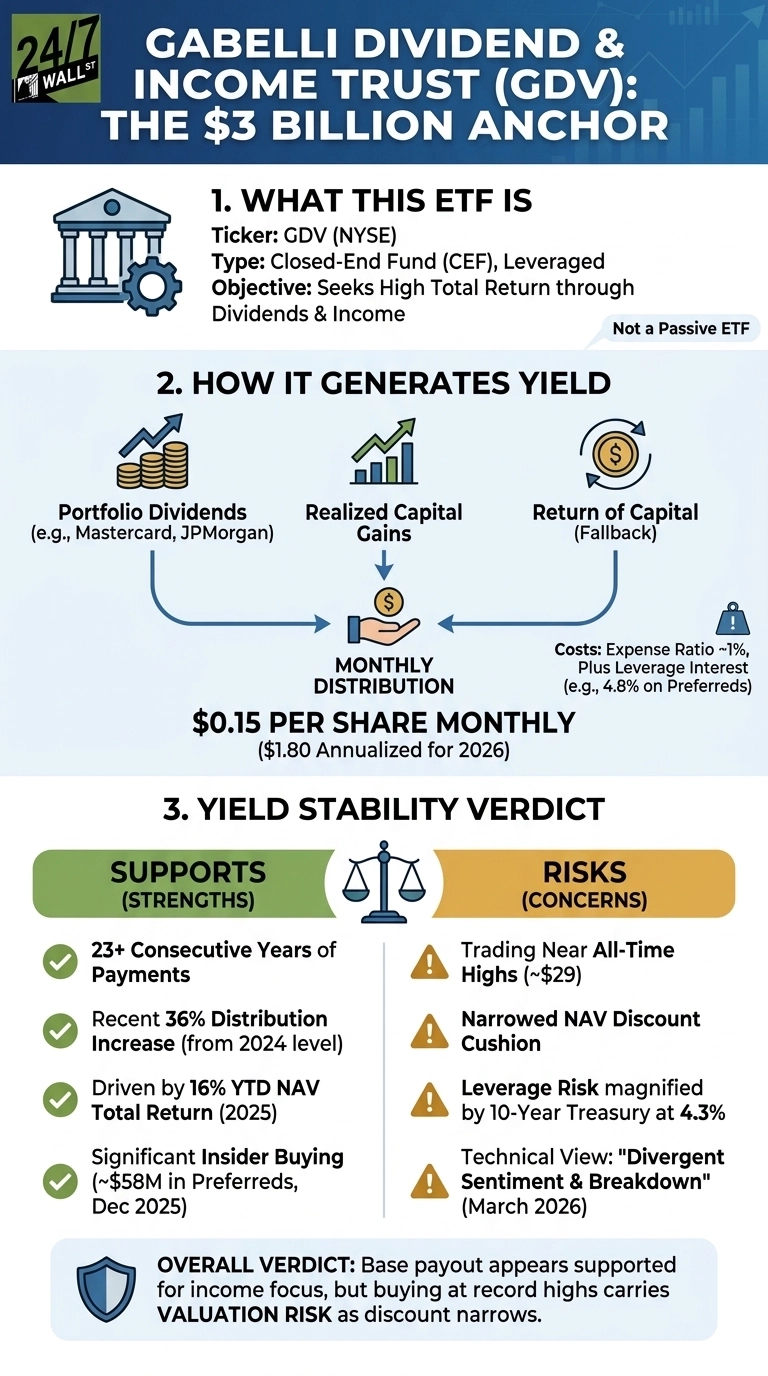
The Gabelli Dividend & Income Trust (NYSE:GDV) has pushed to an all-time high of roughly $29, with shares changing hands at about $29 and annual distributions stepped up to $1.80 per share. This article examines whether the monthly payout is backed by durable cash flow from the underlying portfolio, or whether the rally has pulled the fund into valuation-trap territory as its historic discount to net asset value narrows.
How the Payout Is Manufactured
GDV is a closed-end fund with structural features that differ from a passive ETF. According to the Gabelli Q1 2025 Fact Sheet, it holds roughly 613 securities across dividend-paying equities and uses leverage through preferred share issuance to amplify income. The monthly $0.15 distribution is funded from three sources: dividends received from portfolio holdings, realized capital gains, and, when those fall short, return of capital. Gabelli declares roughly three to four months of payments in advance, which constrains management’s ability to react to sudden drawdowns in underlying income.
The expense ratio of about 1% is elevated relative to passive dividend ETFs, reflecting active management and leverage costs. The fund also pays 4.8% on its Series M preferred shares, a fixed financing cost that must be cleared before common shareholders see a dime.
What Actually Pays the Dividend
The top holdings skew toward high-quality compounders with conservative payout ratios rather than classic high-yield names.
| Holding | Role in Income |
|---|---|
| Mastercard | Low-yield, high cash-flow compounder; dividend growth anchor |
| JPMorgan Chase | Core bank dividend payer with stress-tested capital |
| American Express | Credit-cycle sensitive but well-covered payout |
| Microsoft | Low-yield, strong free cash flow coverage |
| Philip Morris | High-yield contributor; elevated payout ratio |
Sector weighting is concentrated in Financial Services at 18%, followed by Health Care at 9% and Food and Beverage at 7%. Most of these names have payout ratios below 60% and multi-decade dividend histories, meaning the underlying income stream is insulated against any single company cutting its dividend. The weakness is that GDV’s trailing dividend yield requires more cash than the portfolio’s raw dividend income can provide, so the fund has to harvest gains or tap the return of capital to meet the $1.80 target.
The Leverage and NAV-Discount Problem
GDV’s 2026 payout increase didn’t come out of nowhere. It was powered by the fund’s strong 16 percent NAV total return in 2025, which gave management room to lift the monthly rate by roughly 36 percent from the 2024 level. The flip side is the same force that helped on the way up: leverage cuts both ways. If NAV rolls over, the decline gets amplified, and a 10‑year Treasury yield of around 4.3 percent raises the cost of carrying the preferred‑share financing stack. A prolonged equity pullback, combined with higher financing costs, would tighten the margin supporting today’s distribution.
Insider activity does offer a bit of reassurance. Mario Gabelli bought about $58 million of Series M preferred shares in December 2025, and directors added common shares in early 2026. The stock has also had a strong run, up roughly 36 percent over the past year with a total return of 35 percent, ahead of the S&P 500’s 31 percent. The wide 12 percent NAV discount noted in early‑2025 commentary has narrowed meaningfully as the market has rallied.
Safety Verdict
The base monthly payout looks well supported by the portfolio’s dividend income, the fund’s 23‑year record of uninterrupted payments, and management’s willingness to put personal capital behind the structure. The caveat is the rally itself. With the discount now tight and the share price near the upper end of its 52‑week range of $23 to $30, the extra cushion that a wide discount once provided has mostly disappeared.
Income‑focused holders still have a reasonably secure payout. New buyers stepping in at record highs are paying full price for that income, and the March 2026 “divergent sentiment and breakdown” call from Stock Traders Daily is a reminder that leveraged CEFs can cut sharply when NAV momentum turns.