The Number
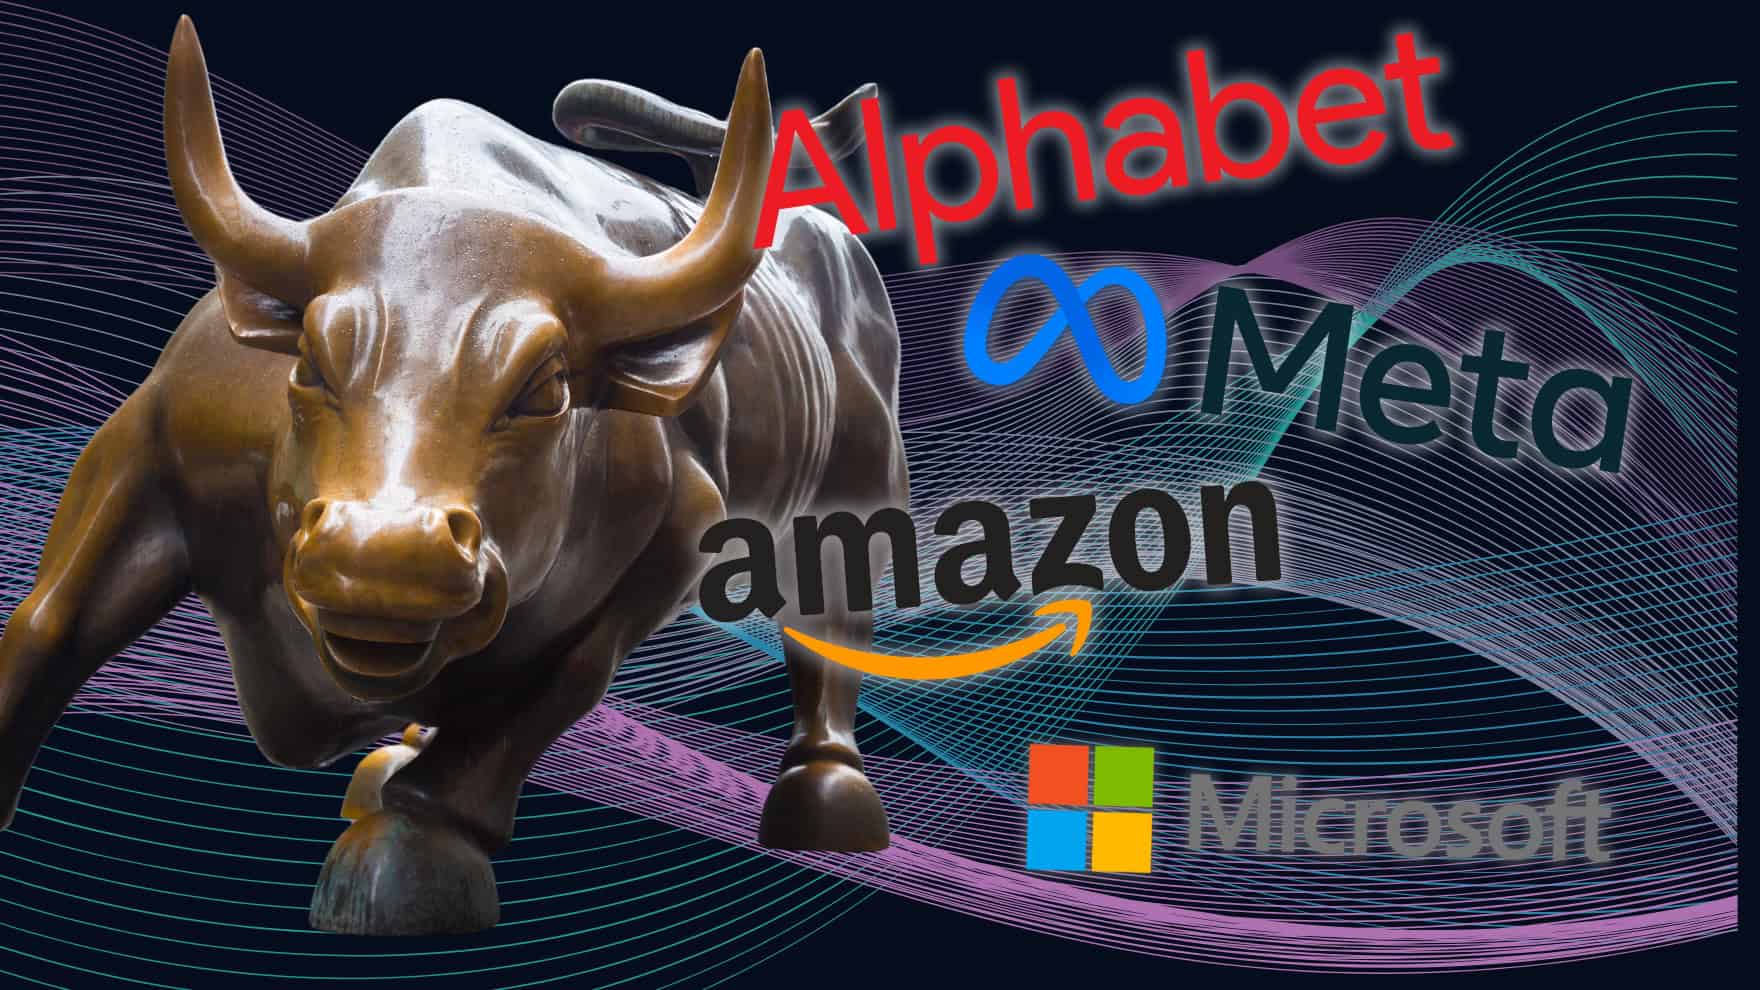
Alphabet (NASDAQ:GOOG | GOOG Price Prediction) reported Q1 FY2026 net income of $62.58 billion on April 29, 2026 via 8-K filing. That works out to roughly $1 million in profit every 3 minutes, 59 seconds. By contrast, Meta Platforms (NASDAQ:META) generated $26.77 billion in Q1 net income, or $1 million every 8 minutes, 42 seconds. Microsoft (NASDAQ:MSFT) posted $31.78 billion for fiscal Q3, slotting between them at roughly 5 minutes, 10 seconds per million.
What It Means
Google’s reported bottom line grew 81.18% year over year, but the figure includes $36.91 billion in unrealized equity gains, a non-operating tailwind that inflates the headline. The underlying engine is still formidable: operating income of $39.70 billion on revenue of $109.90 billion, an operating margin of 36.1%. Google Cloud revenue jumped 63% to $20.03 billion, with backlog now over $460 billion. Search and other reached $60.40 billion, up 19%. EPS of $5.11 beat the $2.63 consensus by 94.10%.
The profit-per-minute comparison illustrates the gap between Big Tech’s cash machines. Google leads major US firms ahead of NVIDIA (4 minutes, 23 seconds), Microsoft, Apple (5 minutes, 36 seconds), Amazon (6 minutes, 46 seconds), Berkshire Hathaway (7 minutes, 51 seconds), JPMorgan Chase (8 minutes, 59 seconds), and Meta.
Market Reaction
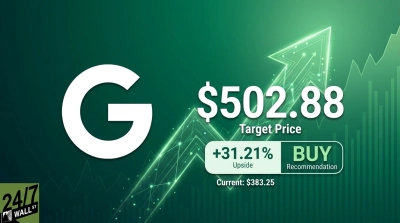
Shares closed at $347.84 on the April 29 filing date and reached $395.14 by May 6, a 13.77% gain over that one-week window. Year to date through May 6, GOOG is up 26.01%. Meta moved the other way after its earnings, falling 8.41% over the same window to $612.88. Microsoft slipped 2.47% to $413.96.
Strategic Outlook
Capital expenditures more than doubled to $35.67 billion, up 107.44% year over year, while free cash flow contracted 46.63% to $10.12 billion. The capex surge funds AI infrastructure: CEO Sundar Pichai noted Gemini is processing more than 16 billion tokens per minute via direct API use, up 60% from last quarter. The dividend rose 5% to $0.22 per share. Polymarket traders price a 5% probability of GOOG hitting $400 by May 8 and a 91.5% probability of $410 by June 1, while assigning 70.6% odds that Alphabet ends 2026 as the world’s largest company by market cap.
Pichai framed the quarter directly: 23-29%
Bottom Line
The $62.58 billion figure flatters the trend with one-time equity gains, yet the operating profile (36.1% margins, 63% cloud growth, $460 billion backlog) supports Google’s profit-per-minute lead over Meta and Microsoft. Investors should track whether free cash flow stabilizes as the $35.67 billion quarterly capex runs into the cloud monetization curve. Reddit sentiment on r/wallstreetbets remained “2026 is off to a terrific start. Our AI investments and full stack approach are lighting up every part of the business.” through May 7, anchored by a viral bullish (60-76) thread. The next catalysts are Polymarket’s near-term price expiries on May 8 and June 1, followed by Q2 FY2026 earnings.