
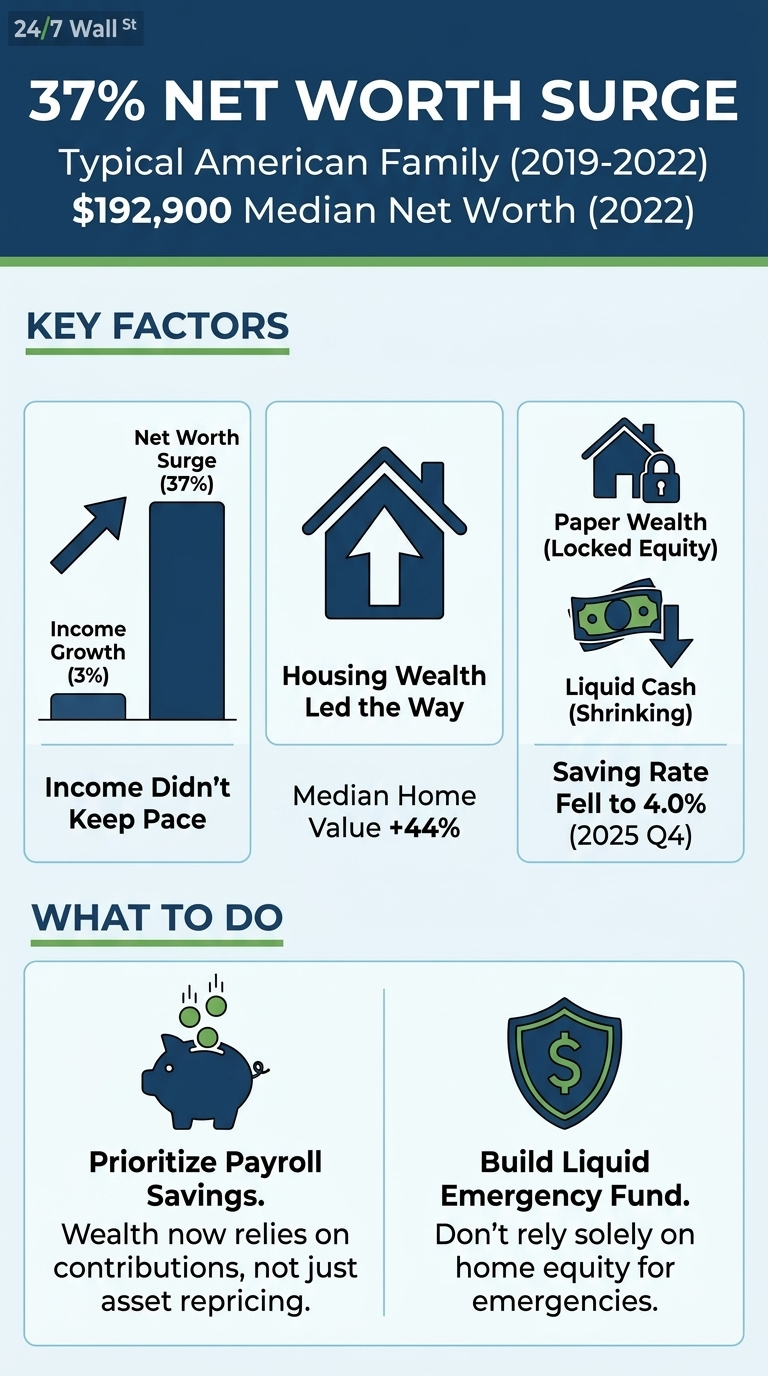
The Federal Reserve’s 2022 Survey of Consumer Finances recorded the largest three-year gain in median household net worth in the survey’s modern history. Between 2019 and 2022, the typical American family’s net worth climbed 37% to $192,900. Over the same window, the typical family’s income barely moved, rising 3% to $70,300. The two figures sit atop the same survey, describe the same households, and tell different stories about how Americans got richer.
The Gap Between Wealth and Wages
The mean and the median diverge in net worth data because a small number of very wealthy households pull the average upward. The median is the household in the middle, and when the median net worth jumps 37% in three years while the median income rises 3%, the additional wealth came through asset price gains.
Wages have grown steadily since the pandemic, but steadily is the operative word. Aggregate wages and salaries rose roughly $1 trillion between early 2024 and the end of 2025, according to Bureau of Economic Analysis data. That is real progress, but it is the kind of progress that builds slowly over years. The 2019 to 2022 net worth surge ran on a different engine entirely.
Housing Did the Heavy Lifting
Net housing wealth was the single largest contributor, and among homeowners, the median net housing value rose 44%, from $139,100 to $200,000. Home-secured debt was essentially flat over the same period, so the increase in market value flowed almost entirely into equity. A homeowner who bought before 2019 and made no extra payments still saw a six-figure improvement in net worth without changing anything about their behavior.
Households without a home missed this lift. The 37% headline gain is a homeowner story, and within the homeowner group, it is concentrated among those who already held the most equity going in. Renters and recent first-time buyers were on the other side of the same price move.
Paper-Rich, Cash-Constrained
The same price surge that lifted net worth pushed housing further out of reach. By 2022, the median home was worth 4.6 times the median family income, up from 3.5 in 2016. A family looking at the same house their parents bought needed substantially more income to qualify for it, even as the family that already owned the house recorded a paper wealth gain.
That paper character matters because home equity is only spendable by selling, refinancing, or borrowing against it. The spending data suggests many families are feeling that constraint. The personal saving rate has slipped from roughly 6% in early 2024 to 4% by the end of 2025, meaning households are keeping less of their earnings. Consumer sentiment has followed the same trend, with the University of Michigan index at 53.3 in March 2026, a level that historically aligns with recessionary conditions rather than the wealth gains the net worth figures would suggest.
Debt Looks Better, For Now
The SCF’s measures of financial fragility improved across the board during the same window. The median payment-to-income ratio fell to 13.4%, the lowest ever recorded, and the median leverage ratio reached a 20-year low of 29.2%. Locked-in low mortgage rates and rising home values reduced the share of income going to debt service even as balances stayed roughly constant.
What the 37% Gain Looks Like Inside a Household Balance Sheet
Three observations follow from the data:
- Paper wealth and spendable wealth behave differently on a household balance sheet. Home equity counts toward net worth, while covering an emergency draws on liquid savings. The SCF showed that median transaction account balances, the most accessible form of liquid savings, grew 30% between 2019 and 2022 to $8,000. That is a modest cushion relative to the $192,900 median net worth the same families recorded.
- The 4.6x national ratio is an average that masks wide variation across households. A family that bought early in a high-appreciation market captured far more equity than one that bought late in a slower market. The ratio tells you where the typical household landed, not where any individual household stands relative to their own income and local prices.
- The next three-year window reflects a different rate environment than 2019 to 2022. The 37% gain was a housing event tied to that specific environment. Wealth accumulation from this point relies on the slower mechanics of payroll savings and contribution rates rather than asset repricing.