
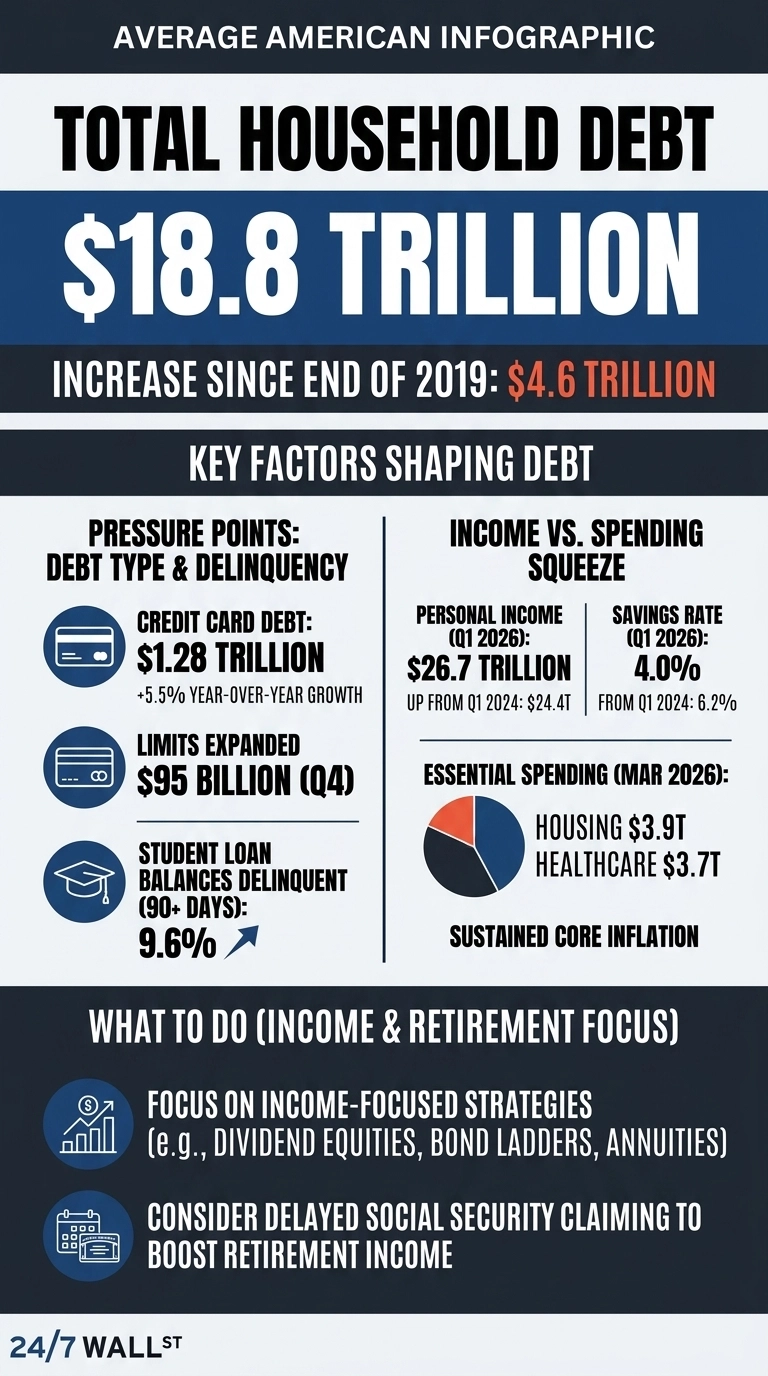
The New York Fed’s Q4 2025 Household Debt and Credit report puts a hard number on something most Americans already feel in their bank accounts. Total household debt hit $18.8 trillion at the end of the fourth quarter, up $4.6 trillion since the end of 2019, and that kind of growth does not happen without consequences. Those consequences are now showing up in the delinquency data, and the picture they paint is considerably more complicated than the income and employment numbers alone would suggest.
Delinquency rates rose to 4.8% of outstanding debt in the fourth quarter, up 0.3 percentage points from the prior quarter, with early delinquency transitions ticking higher across mortgages and climbing more sharply in student loans. The stress that has been quietly building on household balance sheets for two years is no longer staying quiet. It is moving through the system in ways that are now visible in the data.
Credit Cards Are Where the Pressure Shows First
Revolving credit is where the pressure shows up first. Credit card balances climbed 5.5% year-over-year to $1.28 trillion while lenders simultaneously expanded credit card limits by $95 billion in the quarter alone. Households are leaning harder on plastic, and issuers are letting them, which is a combination that tends to look manageable right up until it stops.
The pressure is structural rather than crisis-driven. Unemployment sat at 4.3% in March 2026, and initial jobless claims fell to 189,000 in late April, both consistent with a labor market that is still holding up. People are working, and wages are nominally higher. They are still borrowing more to keep up, and the gap between employment health and financial health is exactly what the delinquency trend is starting to reflect.
Student Loans Are the Other Half of the Story
Student loans are where the damage is most concentrated, and the numbers are not subtle. A staggering 9.6% of outstanding student loan balances are now seriously delinquent, and roughly one million borrowers were transferred to the Department of Education’s Default Resolution Group after payment reporting resumed following the extended pandemic forbearance period. That is not a temporary blip. It is a structural backlog that will work its way through credit reports, debt-to-income ratios, and mortgage applications for years, quietly narrowing the financial options of an entire generation of borrowers long after the delinquency itself has cleared.
Why Households Are Borrowing More While Earning More
Higher paychecks have not produced bigger cushions. Personal income climbed roughly $2,266 billion between the first quarter of 2024 and the first quarter of 2026. Per capita disposable income reached $68,617, and yet the personal savings rate fell from 6.2% to 4.0% over the same stretch. Every additional dollar coming in found somewhere else to go before it reached savings.
Housing and healthcare are absorbing most of it. Both categories account for the largest and fastest-growing shares of personal consumption, and neither can be cut when budgets get tight. The PCE price index rose 0.7% in March alone and is up 3.5% year-over-year, with core inflation running at 3.2%. Real purchasing power continues to be eroded in exactly the categories with no flexible alternatives.
Borrowing costs pile on top of that squeeze. The Fed has cut its policy rate from 4.5% to 3.75% since September 2025, but credit card rates and home equity lines are still priced in restrictive territory. Households are servicing pandemic-era debt at post-pandemic rates, and the combination of rising essential costs, falling savings, and sticky borrowing costs is precisely what the delinquency data is now beginning to reflect.
The Mood Matches the Math
The mood and the money are telling the same story. Consumer sentiment registered 53.3 in March 2026, down from 61.7 in July 2025 and sitting well below the 60 level economists associate with recessionary readings. Retail sales held firm at $752.1 billion in March, which sounds encouraging until you realize that spending at that level, with sentiment that low, means households are consuming out of necessity rather than confidence. That gap between what people are buying and how they feel about buying it has a way of closing in one direction only.
What This Means for Retirement Planning
The $4.6 trillion in debt accumulated since 2019 does not disappear at retirement age, and that is the part of this report nobody wants to talk about. Households entering their fifties and sixties carrying credit card balances, student loan obligations, and mortgages refinanced at higher rates are not walking into retirement with lower fixed costs. They are walking in with a debt stack that needs servicing on top of everything else, and the traditional assumption that expenses fall once the mortgage is paid is being dismantled in real time by revolving balances that previous generations simply did not carry at the same stage of life.
That shift makes income-focused investing structural rather than optional, and the distinction matters. Dividend equities, bond ladders, annuitized portfolio positions, and delayed Social Security claiming are no longer conservative choices for cautious investors. For a growing share of retirees and near-retirees, they are the difference between a retirement that works and one that runs out. The New York Fed data does not tell you when the next delinquency wave hits. What it does is document something more useful: the cushion has thinned, the debt has thickened, and the bill for a half-decade of borrowing is coming due right on schedule.