24/7 Wall St. Insights
- The economy has historically ranked among the most important issues for voters in election years, and 2024 is no different
- With Election Day only months away, we reviewed the U.S. Presidents who oversaw the best, and worst, job markets
- Also: Discover the next Nvidia
During the 1992 presidential race, Bill Clinton’s chief campaign strategist, James Carville, said “it’s the economy, stupid,” highlighting what matters most in national elections. Clinton, then the Governor of Arkansas, went on to defeat the incumbent Republican George H.W. Bush on Election Day, with 370 electoral votes to Bush’s 168. Now, more than three decades later, the economy remains top of mind for millions of Americans.
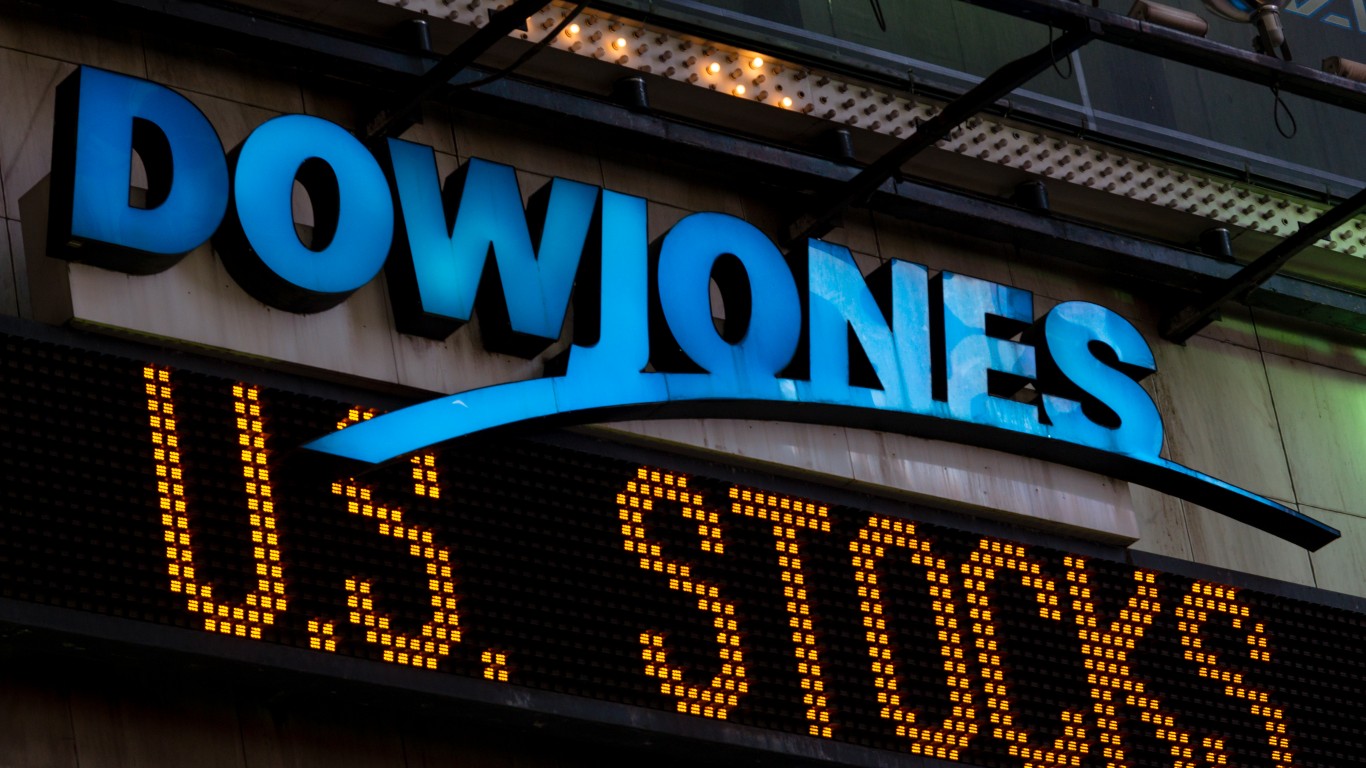
According to an August 2024 poll conducted by public opinion research company Morning Consult, 79% of voters say the economy is very important in deciding which candidate to support in the coming election. For context, of the 19 issues included in the survey, national security ranked as the second highest priority, with 71% of voters identifying it very important. (This is how the stock market did under every U.S. President.)
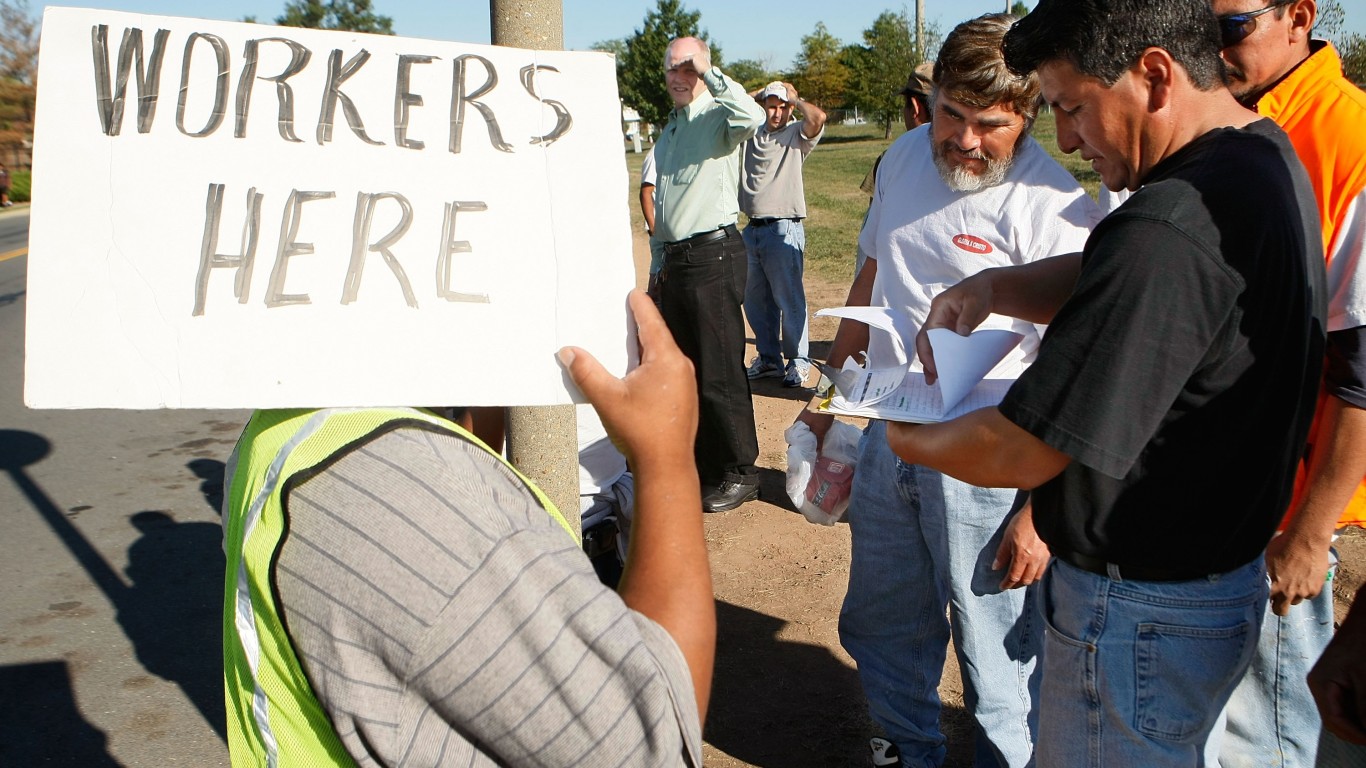
While inflation has recently emerged as a leading economic concern, job creation and unemployment reduction are perennial concerns for much of the electorate. And in recent decades, some presidents have proved far more effective at delivering in those key areas than others.
Using data from the Bureau of Labor Statistics, 24/7 Wall St. identified the presidents with the best and worst job markets. We ranked each U.S. President since 1953 on the average annual unemployment rate during their time in office. In the case of a tie, the president who oversaw the largest decline in unemployment ranks higher.
Because BLS unemployment data is organized by calendar year, and presidential administrations are not, we used the closest annual numbers for each president’s time in office. For example, if a president’s final day in the White House was anytime between January and June of a given year, we used unemployment data from the previous calendar year as a reflection of the job market at the end of their administration.
Among the 13 U.S. presidential administrations since 1953 — from Dwight Eisenhower to Joe Biden — average annual unemployment rates range from 8.1% to 4.1%. It is important to note, however, that the U.S. job market is subject to multiple factors beyond the control of the sitting president. These include, but are not limited to, interest rates set by the Federal Reserve, policies of previous administrations, geopolitical events, and global pandemics. (Here is a look at the U.S. Presidents who added the most to the national debt.)
No president in the last 70 years oversaw a greater rise in unemployment than Donald Trump. From Trump’s first year in office in 2017 to his last in 2020, the number of Americans who were unemployed increased by nearly 6 million. The rise was driven almost entirely by the COVID-19 pandemic, which pushed monthly jobless rates to their highest levels in at least 70 years. Under Trump, the annual unemployment rate jumped from a historic low of 3.7% in 2019, to 8.1% in 2020. Still, with a strong job market in first three years in office, Trump compares favorably to most modern presidents.
The pandemic also had a meaningful impact on the U.S. job market under President Biden. The rapid recovery in the wake of the economic shockwaves wrought by COVD-19 pushed the annual unemployment rate down to 5.3% in 2021, Biden’s first year in office, and to 3.6% in 2022, Biden’s second year. During Biden’s three full years in the White House, the number of unemployed Americans fell at an annual rate of nearly 21%, the best average annual improvement of any president in at least 70 years.
Meanwhile, Clinton, a Democrat who famously campaigned on an economic platform, is the only president since 1953 who oversaw a decline in the annual unemployment rate in every year of his administration. Under Clinton, the annual jobless rate fell from 6.9% in 1993 to 4.0% in 2000. Still, Clinton ranks close to the middle of this list, with an average annual unemployment rate of 5.2%.
Why It Matters
The policies of any presidential administration are only one among many factors that can influence the strength of the job market and the overall economy. Still, voter perceptions of the sitting president are often influenced by the state of the economy. Over the last 70 years, through multiple recessions and periods of rapid growth, the annual unemployment rate has fluctuated from less than 3% to nearly 10% — and, right or wrong, the blame or credit often falls at the feet of the president.
13. Gerald Ford (in office from Aug. 1974 – Jan. 1977)
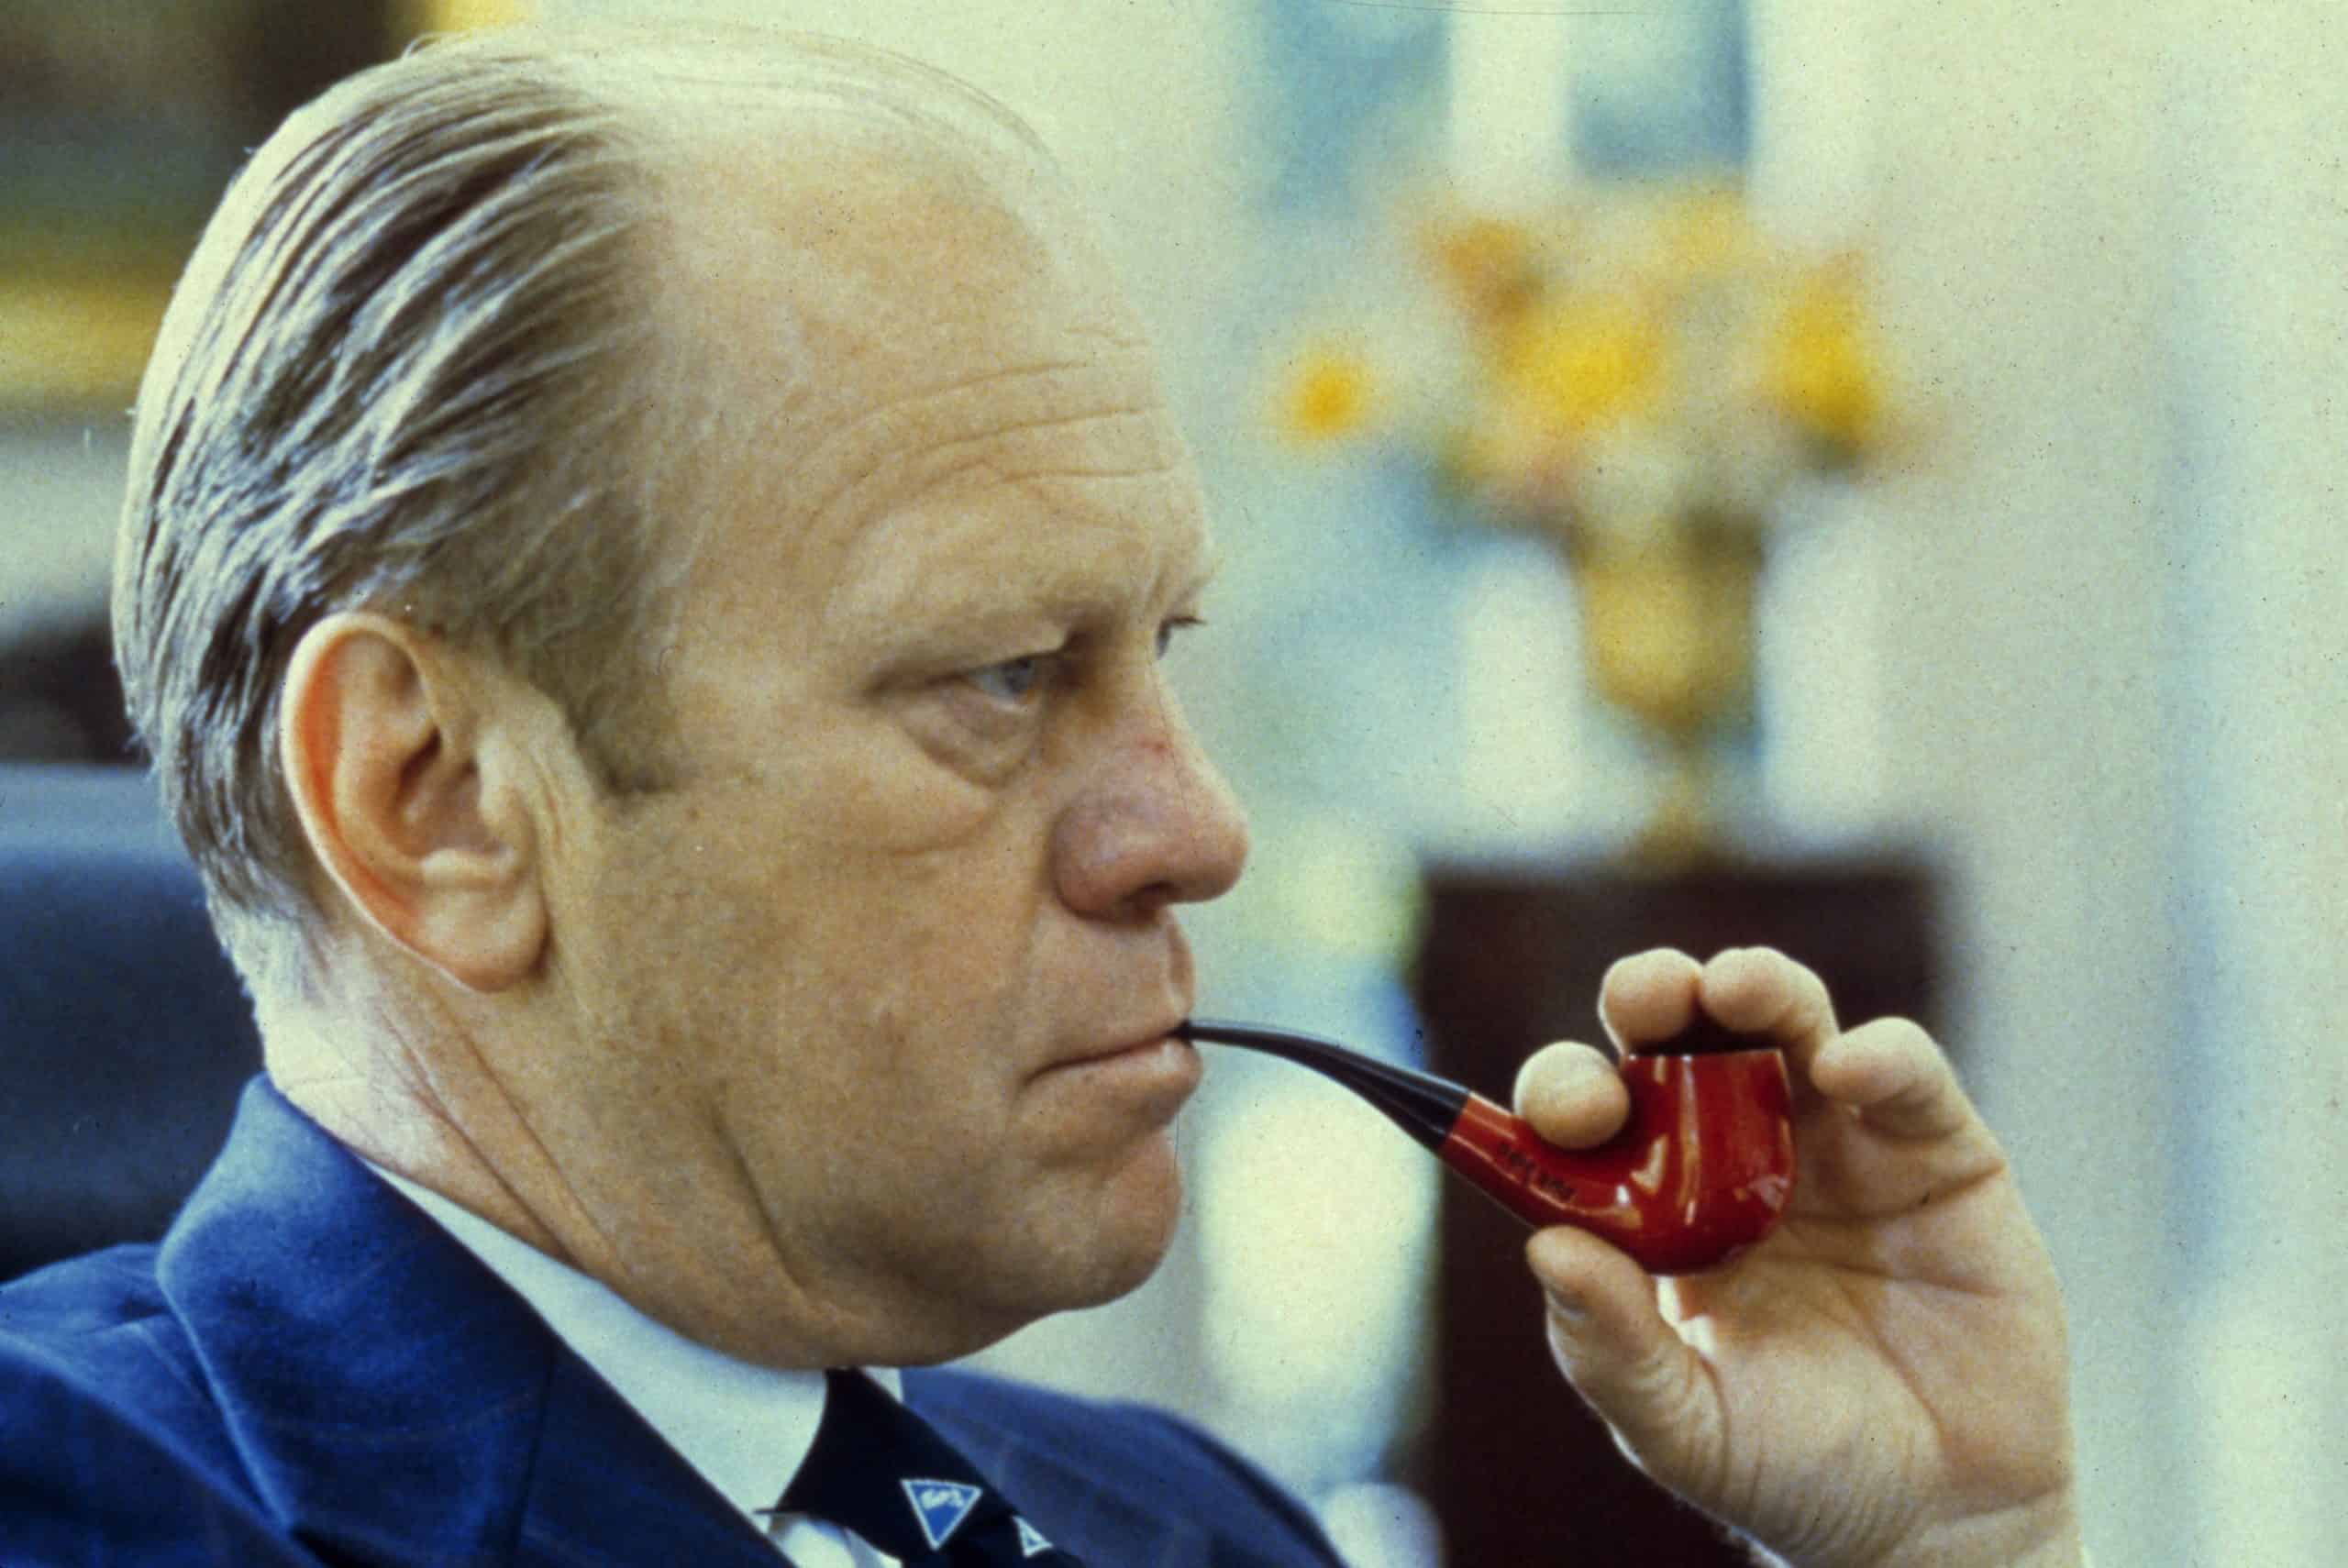
- Avg. annual unemployment rate during presidency: 8.1%
- Lowest and highest annual unemployment rate: 7.7% in 1976; 8.5% in 1975
- Avg. annual change in num. of unemployed Americans: +23.6% (-261,500)
- Net change in unemployed workers during presidency: -523,000
- Party affiliation: Republican
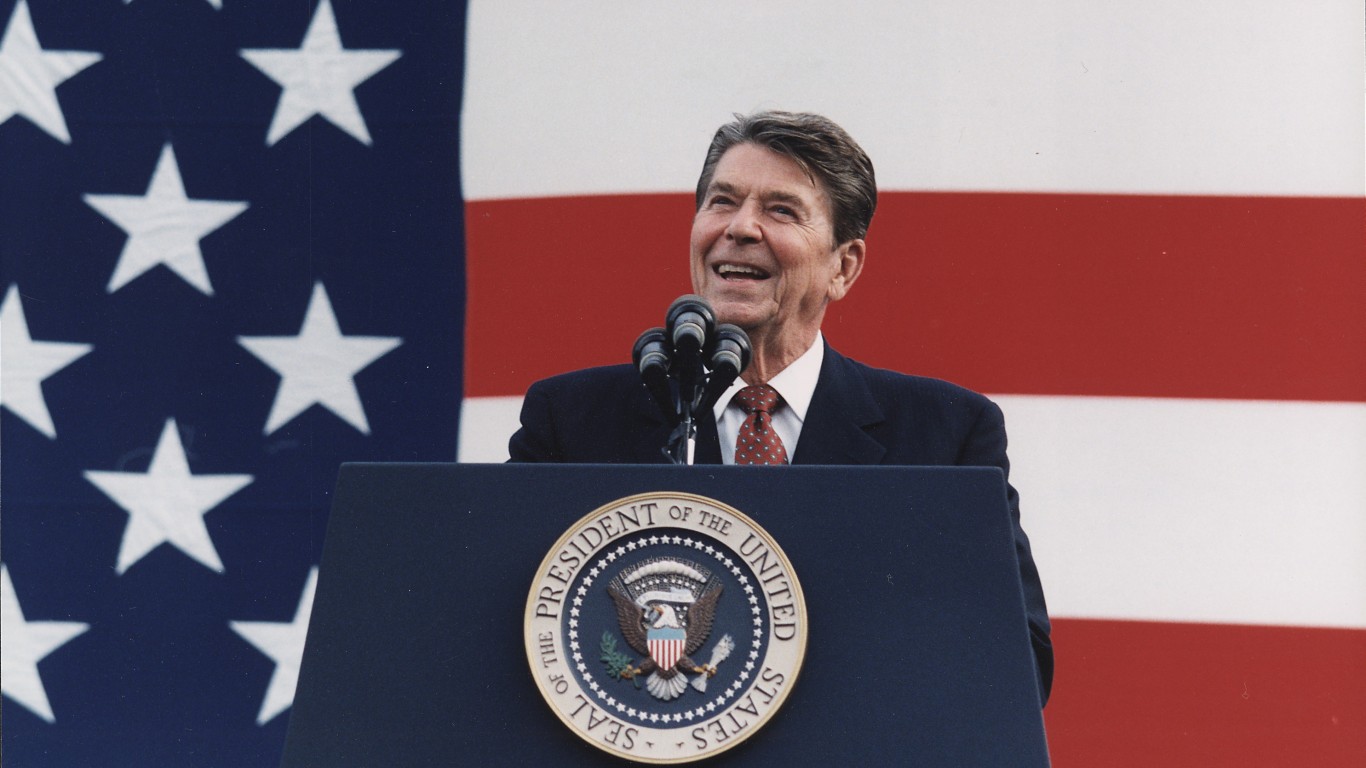
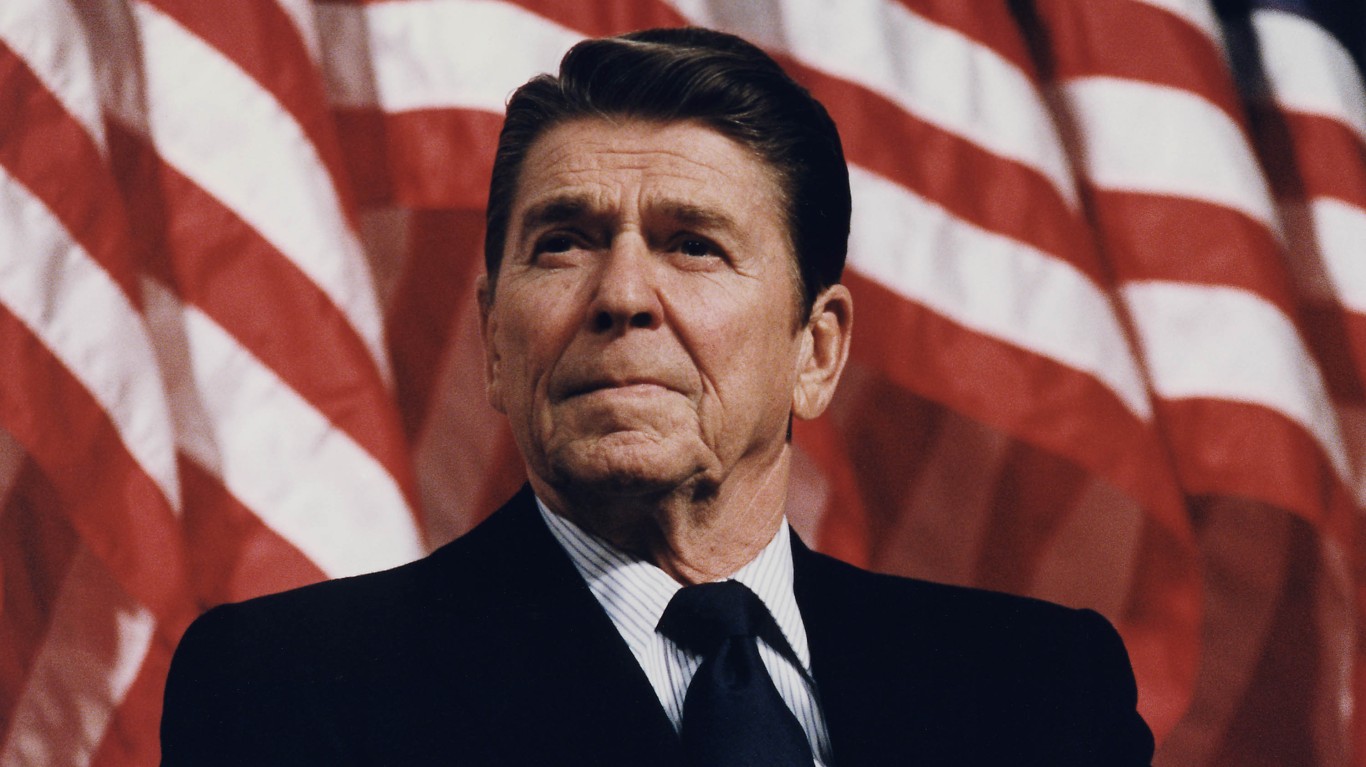
12. Ronald Reagan (in office from Jan. 1981 – Jan. 1989)
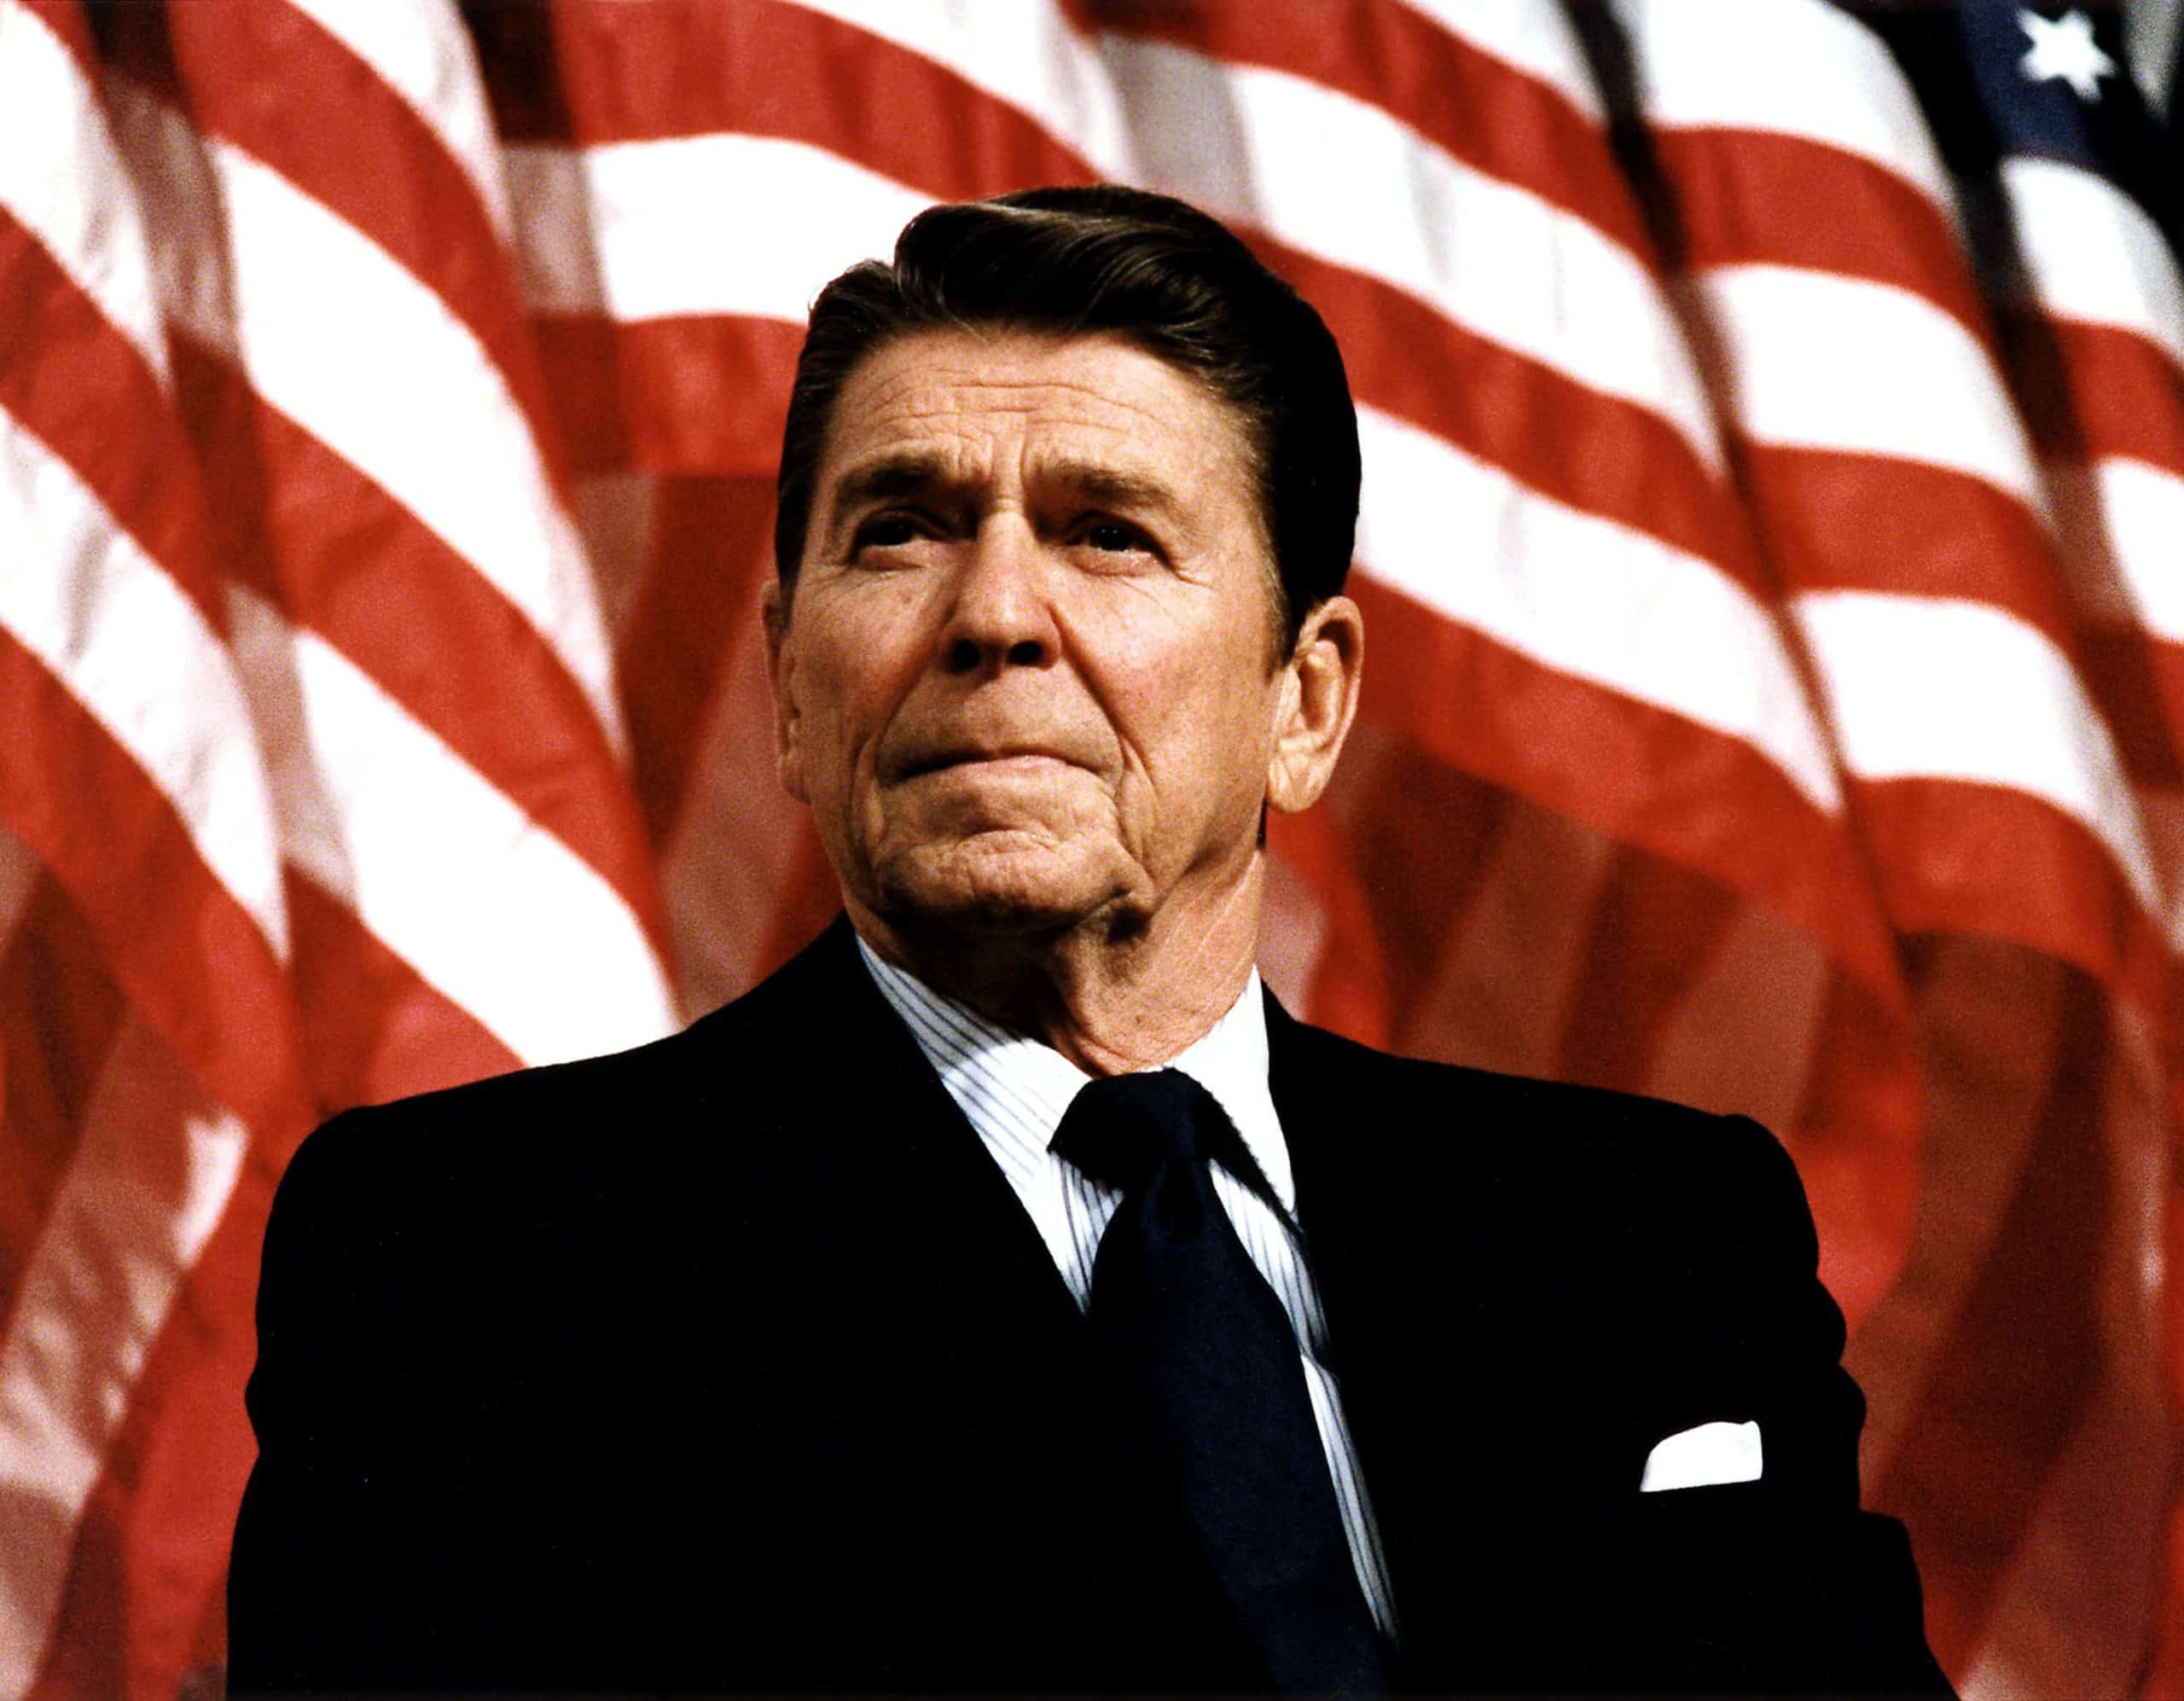
- Avg. annual unemployment rate during presidency: 7.5%
- Lowest and highest annual unemployment rate: 5.5% in 1988; 9.7% in 1982
- Avg. annual change in num. of unemployed Americans: -0.7% (-196,500)
- Net change in unemployed workers during presidency: -1,572,000
- Party affiliation: Republican
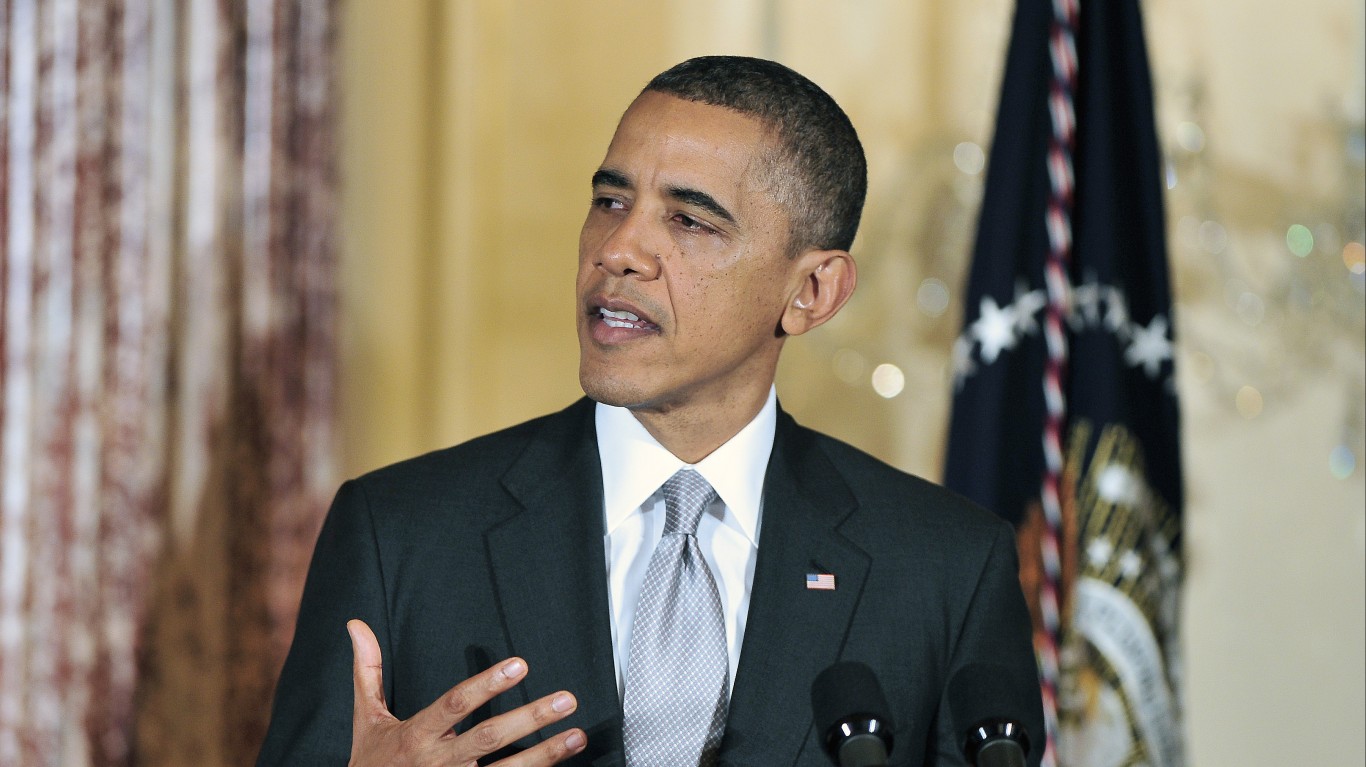
11. Barack Obama (in office from Jan. 2009 – Jan. 2017)
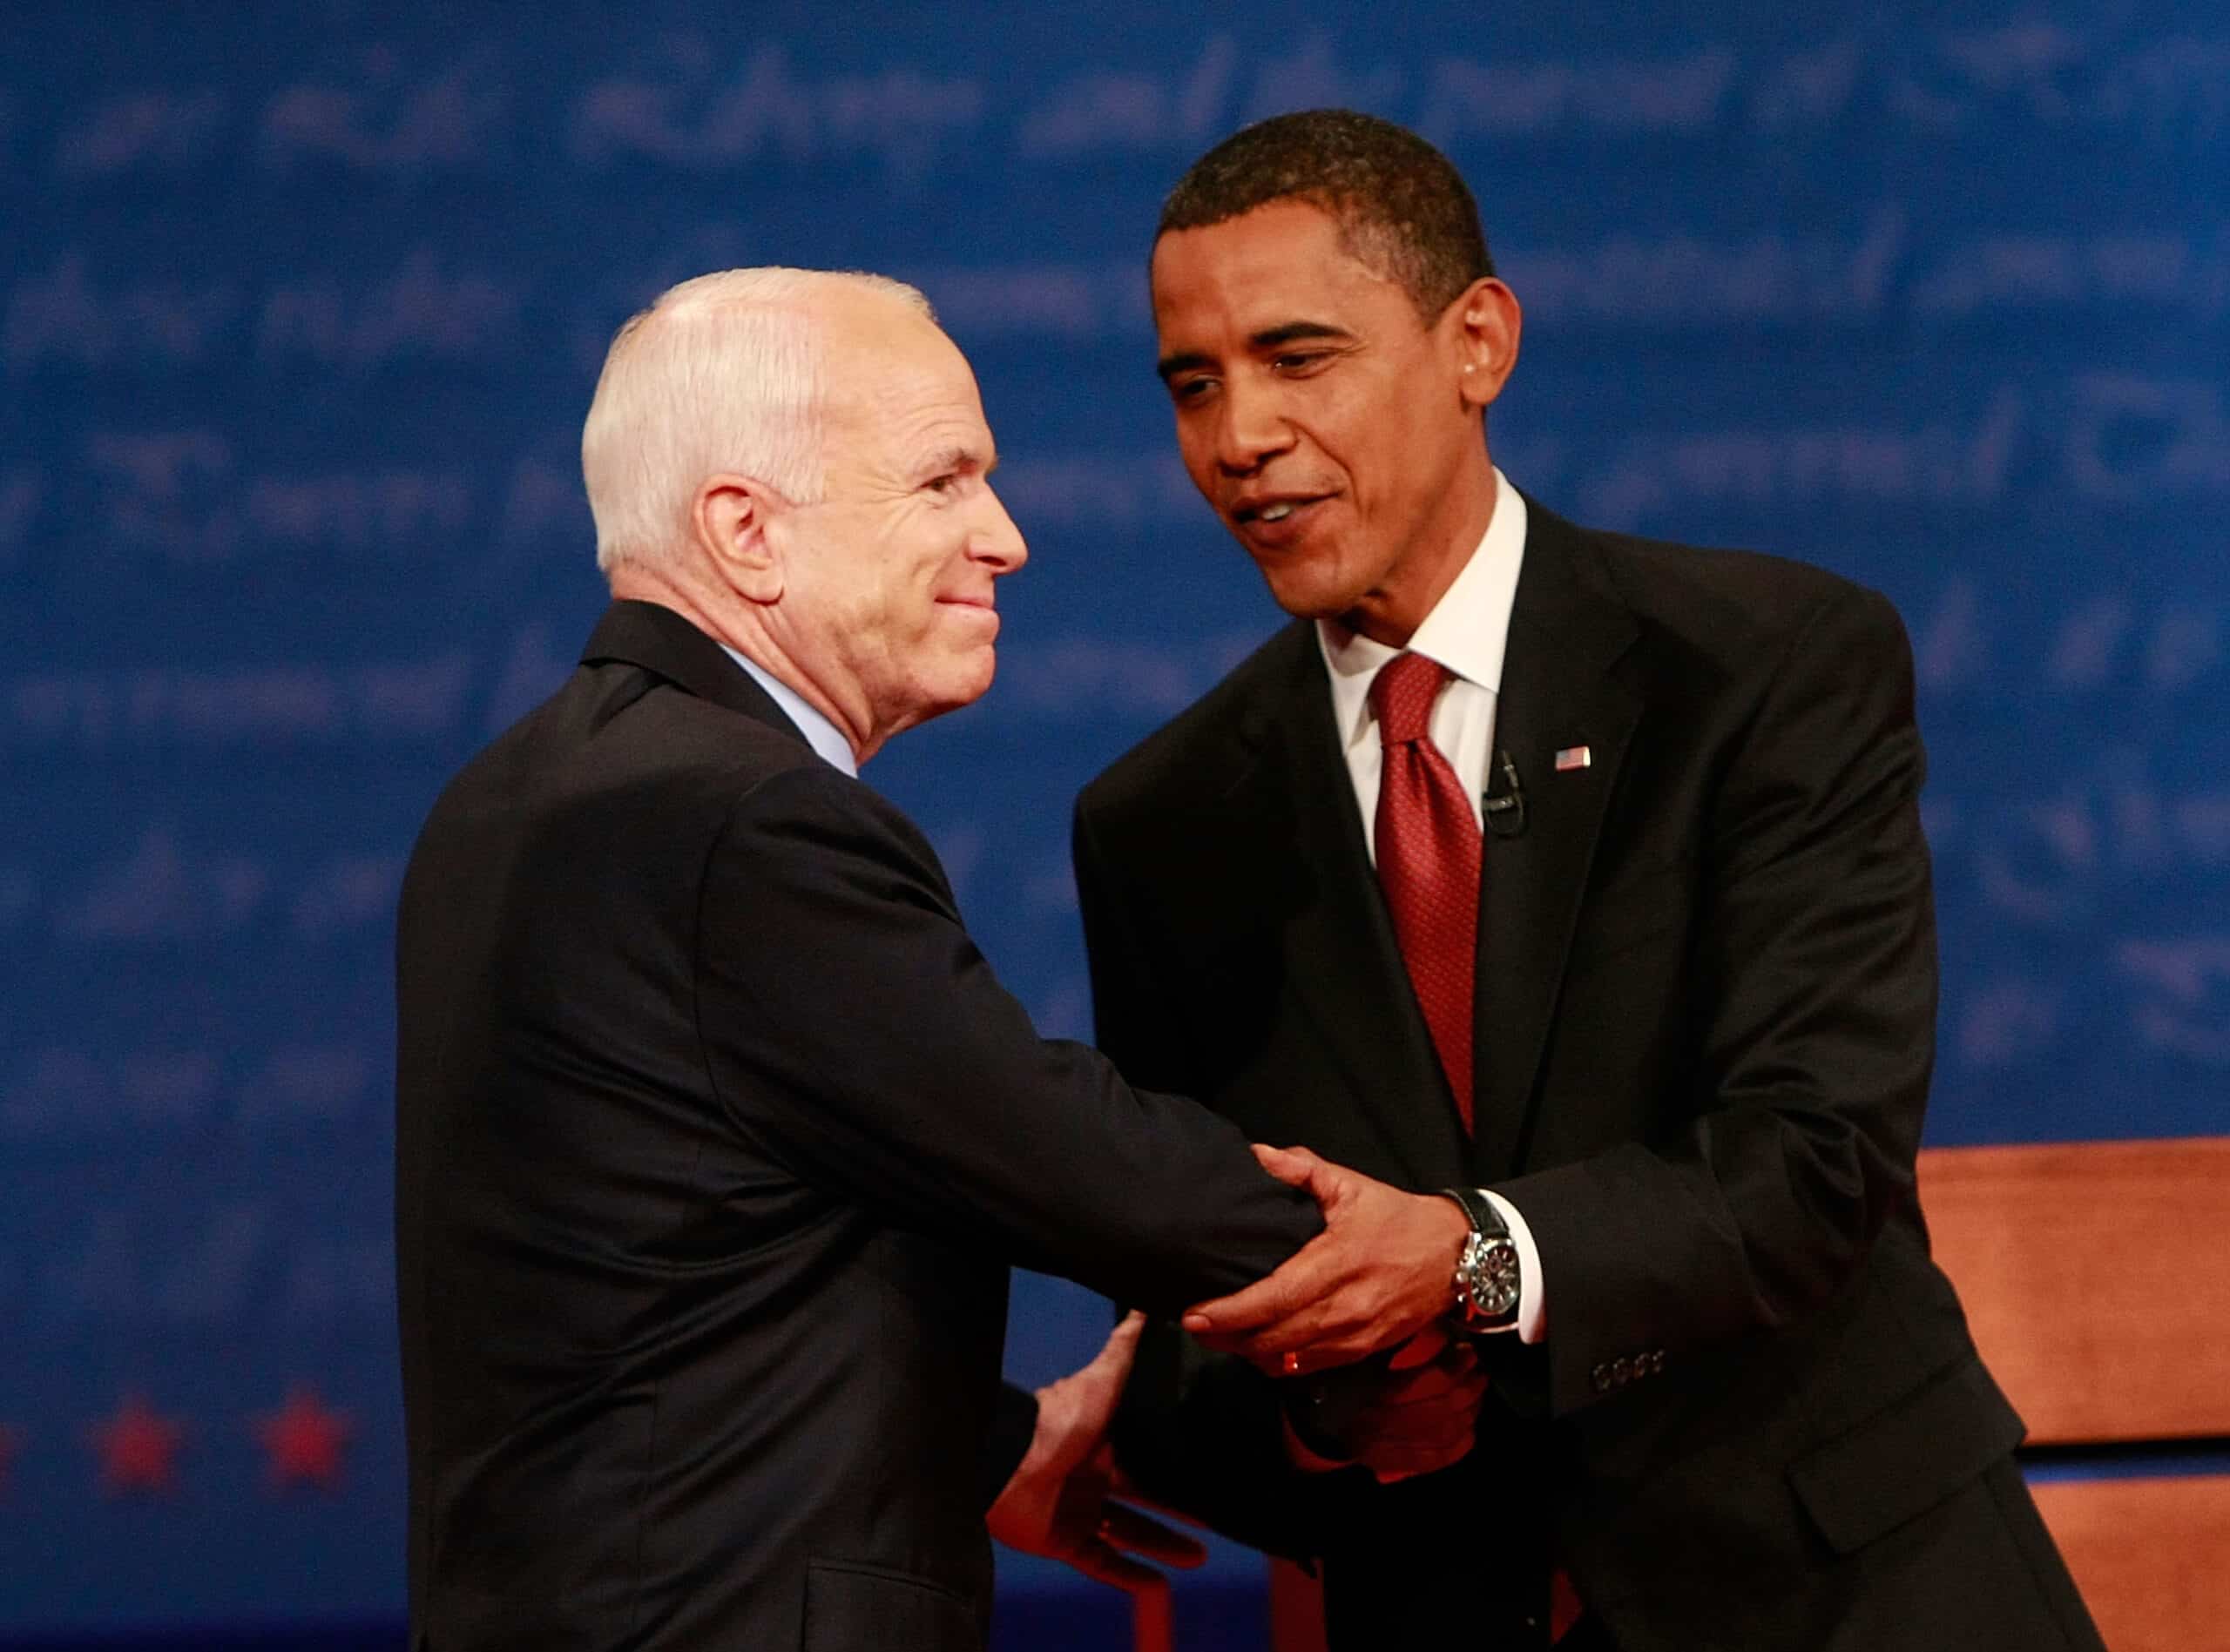
- Avg. annual unemployment rate during presidency: 7.4%
- Lowest and highest annual unemployment rate: 4.9% in 2016; 9.6% in 2010
- Avg. annual change in num. of unemployed Americans: +0.3% (-814,250)
- Net change in unemployed workers during presidency: -6,514,000
- Party affiliation: Democratic
10. Jimmy Carter (in office from Jan. 1977 – Jan. 1981)
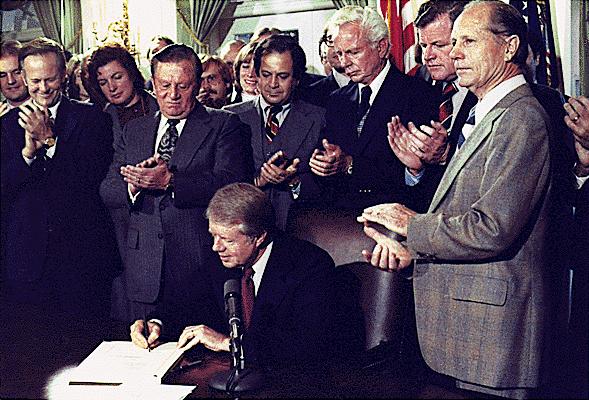
- Avg. annual unemployment rate during presidency: 6.5%
- Lowest and highest annual unemployment rate: 5.8% in 1979; 7.1% in 1977 and 1980
- Avg. annual change in num. of unemployed Americans: +1.6% (+161,500)
- Net change in unemployed workers during presidency: +646,000
- Party affiliation: Democratic
9. George H.W. Bush (in office from Jan. 1989 – Jan. 1993)
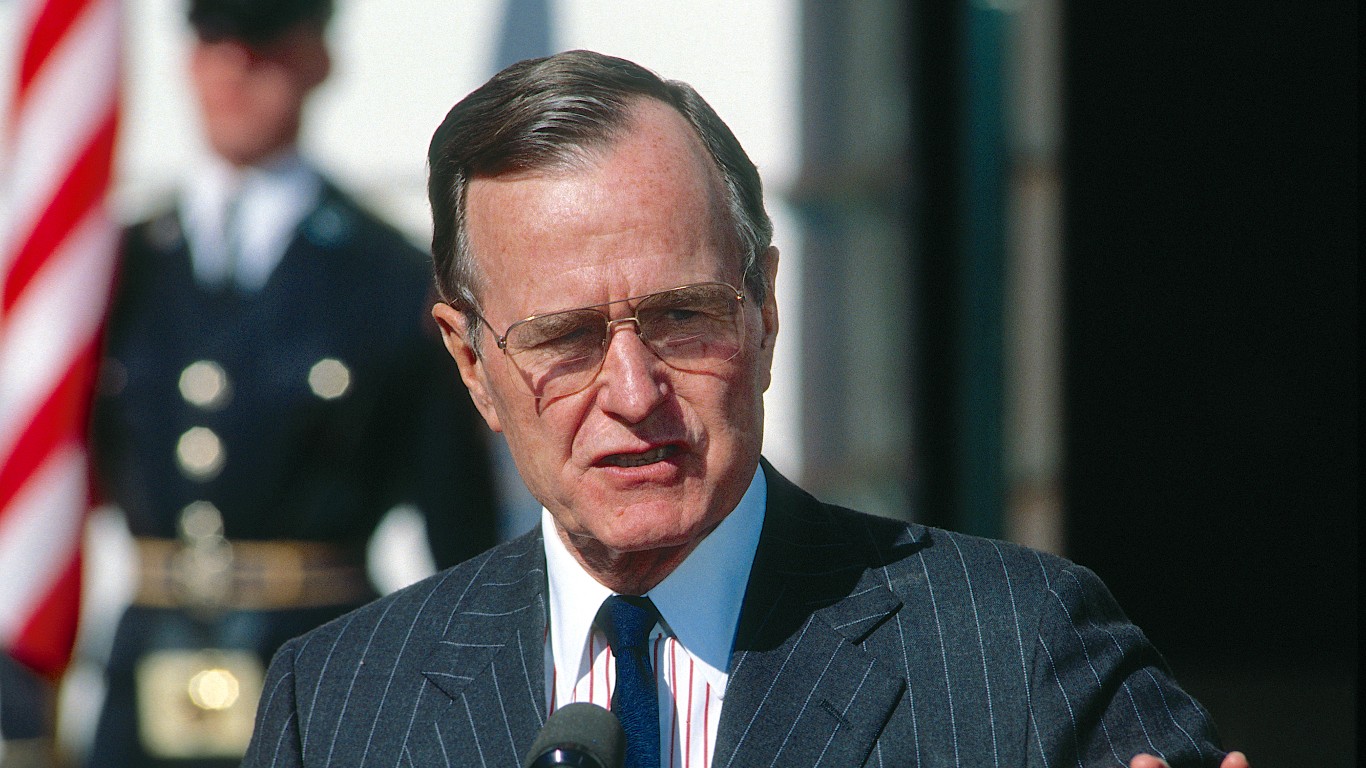
- Avg. annual unemployment rate during presidency: 6.3%
- Lowest and highest annual unemployment rate: 5.3% in 1989; 7.5% in 1992
- Avg. annual change in num. of unemployed Americans: +9.8% (+771,250)
- Net change in unemployed workers during presidency: +3,085,000
- Party affiliation: Republican
8. John F. Kennedy (in office from Jan. 1961 – Nov. 1963)
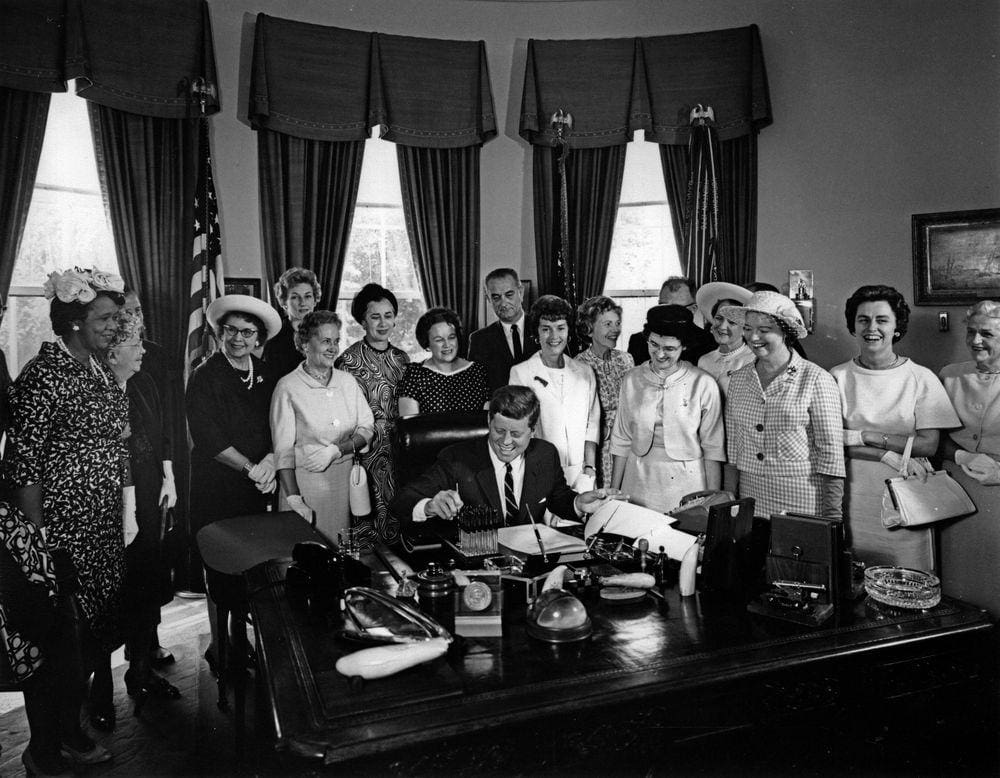
- Avg. annual unemployment rate during presidency: 6.0%
- Lowest and highest annual unemployment rate: 5.5% in 1962; 6.7% in 1961
- Avg. annual change in num. of unemployed Americans: +3.1% (-214,667)
- Net change in unemployed workers during presidency: -644,000
- Party affiliation: Democratic
7. George W. Bush (in office from Jan. 2021 – Jan. 2009)
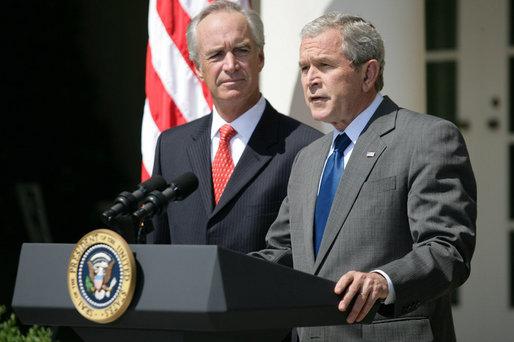
- Avg. annual unemployment rate during presidency: 5.3%
- Lowest and highest annual unemployment rate: 4.6% in 2006 and 2007; 6.0% in 2003
- Avg. annual change in num. of unemployed Americans: +6.6% (+265,375)
- Net change in unemployed workers during presidency: +2,123,000
- Party affiliation: Republican
6. Bill Clinton (in office from Jan. 1993 – Jan. 2001)

- Avg. annual unemployment rate during presidency: 5.2%
- Lowest and highest annual unemployment rate: 4.0% in 2000; 6.9% in 1993
- Avg. annual change in num. of unemployed Americans: -6.3% (-406,000)
- Net change in unemployed workers during presidency: -3,248,000
- Party affiliation: Democratic
5. Richard Nixon (in office from Jan. 1969 – Aug. 1974)

- Avg. annual unemployment rate during presidency: 5.1%
- Lowest and highest annual unemployment rate: 3.5% in 1969; 5.9% in 1971
- Avg. annual change in num. of unemployed Americans: +12.1% (+387,333)
- Net change in unemployed workers during presidency: +2,324,000
- Party affiliation: Republican
4. Donald Trump (in office from Jan. 2017 – Jan. 2021)

- Avg. annual unemployment rate during presidency: 5.0%
- Lowest and highest annual unemployment rate: 3.7% in 2019; 8.1% in 2020
- Avg. annual change in num. of unemployed Americans: +22.8% (+1,491,250)
- Net change in unemployed workers during presidency: +5,965,000
- Party affiliation: Republican
3. Dwight Eisenhower (in office from Jan. 1953 – Jan. 1961)
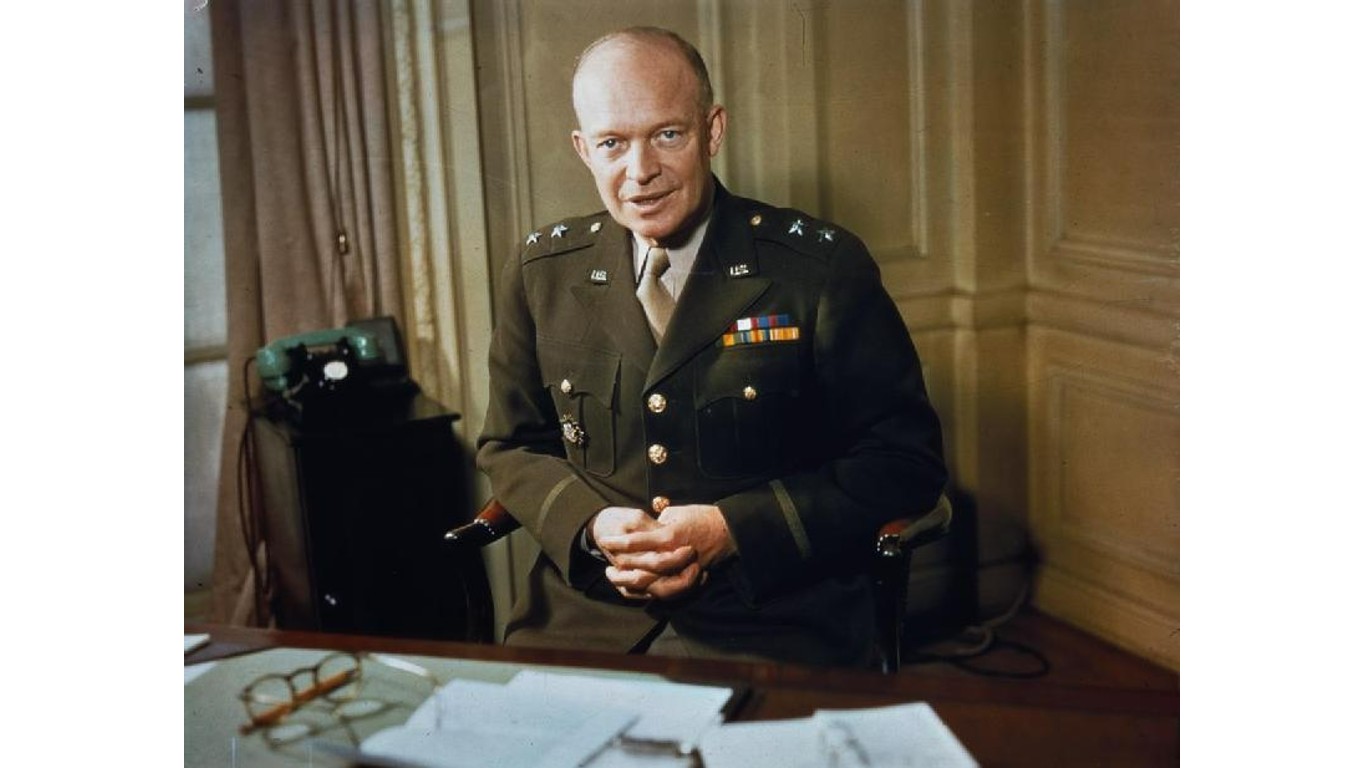
- Avg. annual unemployment rate during presidency: 4.9%
- Lowest and highest annual unemployment rate: 2.9% in 1953; 6.8% in 1958
- Avg. annual change in num. of unemployed Americans: +17.0% (+252,250)
- Net change in unemployed workers during presidency: +2,018,000
- Party affiliation: Republican
2. Lyndon Johnson (in office from Nov. 1963 – Jan. 1969)
 and President Lyndon B. Johnson by Yoichi Okamoto, July 19, 1968 (NARA) by pingnews.com")
- Avg. annual unemployment rate during presidency: 4.2%
- Lowest and highest annual unemployment rate: 3.6% in 1968; 5.2% in 1964
- Avg. annual change in num. of unemployed Americans: -6.9% (-193,800)
- Net change in unemployed workers during presidency: -969,000
- Party affiliation: Democratic
1. Joe Biden (in office from Jan. 2021 – Present)
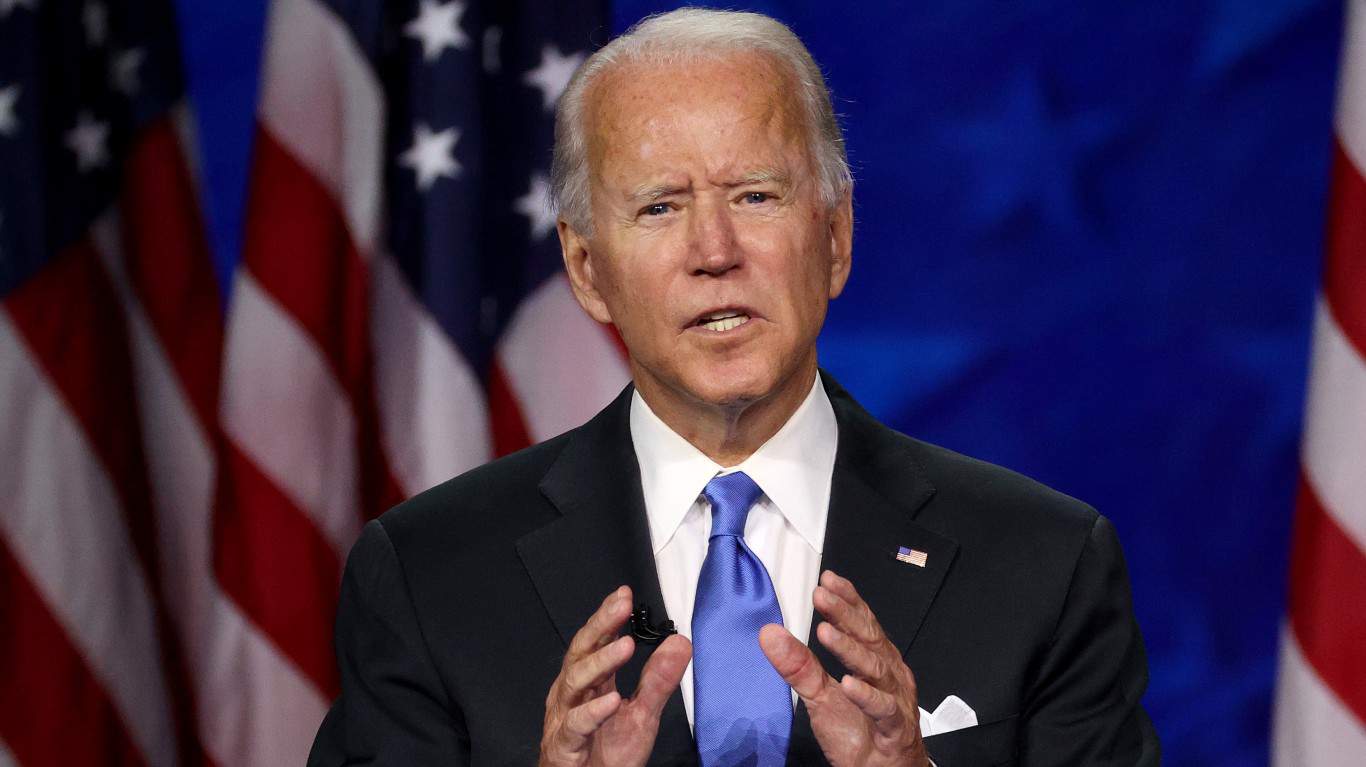
- Avg. annual unemployment rate during presidency: 4.2%
- Lowest and highest annual unemployment rate: 3.6% in 2022 and 2023; 5.3% in 2021
- Avg. annual change in num. of unemployed Americans: -20.8% (-847,667)
- Net change in unemployed workers during presidency: -2,543,000
- Party affiliation: Democratic