24/7 Wall St. Insights
- The economy has historically ranked among the most important issues for voters in election years, and 2024 is no different
- With Election Day only months away, we reviewed the U.S. Presidents who oversaw the strongest job growth
- Also: Discover the next Nvidia
The economy has historically ranked among the most important issues in American politics — and this year is no different. A recent poll conducted by public opinion research company Morning Consult, found that 79% of voters see the state of the economy as very important in deciding which candidate to support in the coming election.
While there are multiple measures for gauging the health of the economy, few have a more direct and meaningful impact on American households than the unemployment rate. With 167.1 million people in the U.S. labor force, every time the unemployment rate rises by a single percentage point, nearly 1.7 million Americans lose their jobs.
The economic impact of rising unemployment can be far reaching. Without a steady paycheck, Americans who are out of work tend to spend less. On a large scale, reduced spending can mean lower revenue for businesses, which can then fuel further job cuts.
While presidents have little direct control over the strength of the job market, their administration’s priorities across multiple policy areas can have economic consequences — and some American presidents have proven far more effective creating jobs and reducing unemployment than others.
Using data from the Bureau of Labor Statistics, 24/7 Wall St. identified the U.S. presidents who oversaw the strongest job growth while in office. We ranked every president since 1953 by the net change in overall employment during their time in office. Because BLS employment data is organized by calendar year, and presidential administrations are not, we used the closest annual numbers for each presidential administration. For example, if a president’s final day in the White House was anytime between January and June of a given year, we used unemployment data from the previous calendar year as a reflection of the job market at the end of their administration.
Among the 13 U.S. presidential administrations since 1953 — from Dwight Eisenhower to Joe Biden — net change in overall employment ranges from a decline of 5.5 million jobs to an increase of 16.6 million. Job growth tends to occur steadily over time, and partially as a result, the highest ranking presidents on this list served for two full terms. The lowest ranking presidents, meanwhile, served only one term or less.
For any presidential administration, job growth does not always translate to falling unemployment. Since the mid-1950s, the U.S. labor force has grown by an average of 1.5 million people annually — and if job growth does not keep pace with rising labor force participation, unemployment goes up. Richard Nixon, for example, served for just over six years, and in that period, the U.S. economy added 8.9 million jobs — stronger growth than most of the 12 other presidents on this list. However, under Nixon, the labor force expanded by 11.2 million. Partially as a result, the annual unemployment rate climbed from 3.5% in Nixon’s first year, to 5.6% in his final year.
It is important to note that while the policies of a sitting president can meaningfully impact the job market, many factors beyond the president’s control can as well. These include, but are not limited to, interest rates set by the Federal Reserve, policies of previous administrations, geopolitical events, and global pandemics. (Here is a look at the U.S. Presidents who added the most to the national debt.)
Why It Matters
The policies of any presidential administration are only one among many factors that can influence the strength of the job market and the overall economy. Still, public sentiment toward the sitting president is often influenced by the electorate’s assessment of their own financial security and of the economy at large. Right or wrong, presidents are often held responsible for the state of the U.S. job market.
13. Donald Trump (in office from Jan. 2017 – Jan. 2021)

- Net change in employment during presidency: -5,542,000 jobs
- Avg. annual change in employment during presidency: -0.6% (-1,385,500 jos)
- Net change in labor force during presidency: +422,000 Americans
- Avg. annual unemployment rate during presidency: 5.0%
- Lowest and highest annual unemployment rate: 3.7% in 2019; 8.1% in 2020
- Party affiliation: Republican
12. George H.W. Bush (in office from Jan. 1989 – Jan. 1993)
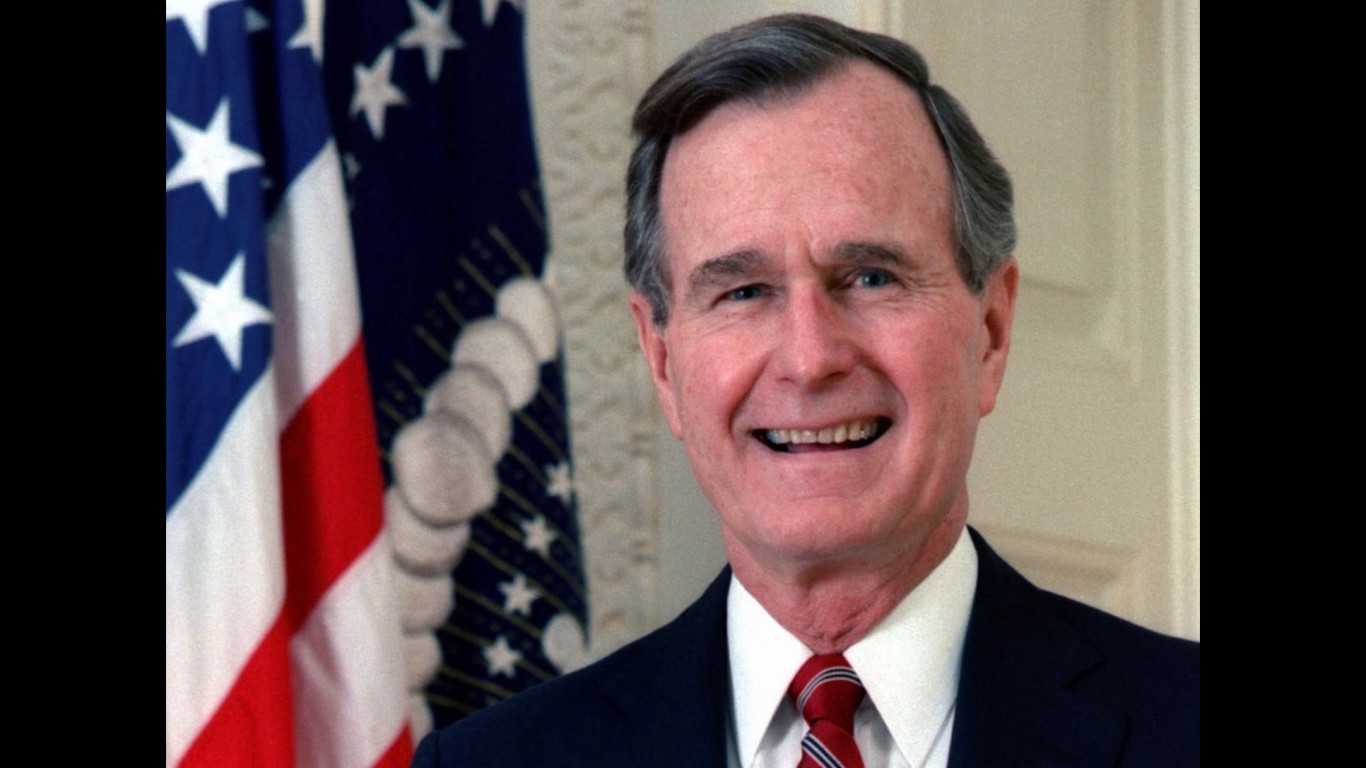
- Net change in employment during presidency: +1,150,000 jobs
- Avg. annual change in employment during presidency: +0.8% (+287,500 jobs)
- Net change in labor force during presidency: +4,236,000 Americans
- Avg. annual unemployment rate during presidency: 6.3%
- Lowest and highest annual unemployment rate: 5.3% in 1989; 7.5% in 1992
- Party affiliation: Republican
11. John F. Kennedy (in office from Jan. 1961 – Nov. 1963)
- Net change in employment during presidency: +2,016,000 jobs
- Avg. annual change in employment during presidency: +1.0% (+672,000 jobs)
- Net change in labor force during presidency: +1,374,000 Americans
- Avg. annual unemployment rate during presidency: 6.0%
- Lowest and highest annual unemployment rate: 5.5% in 1962; 6.7% in 1961
- Party affiliation: Democratic
10. Gerald Ford (in office from Aug. 1974 – Jan. 1977)
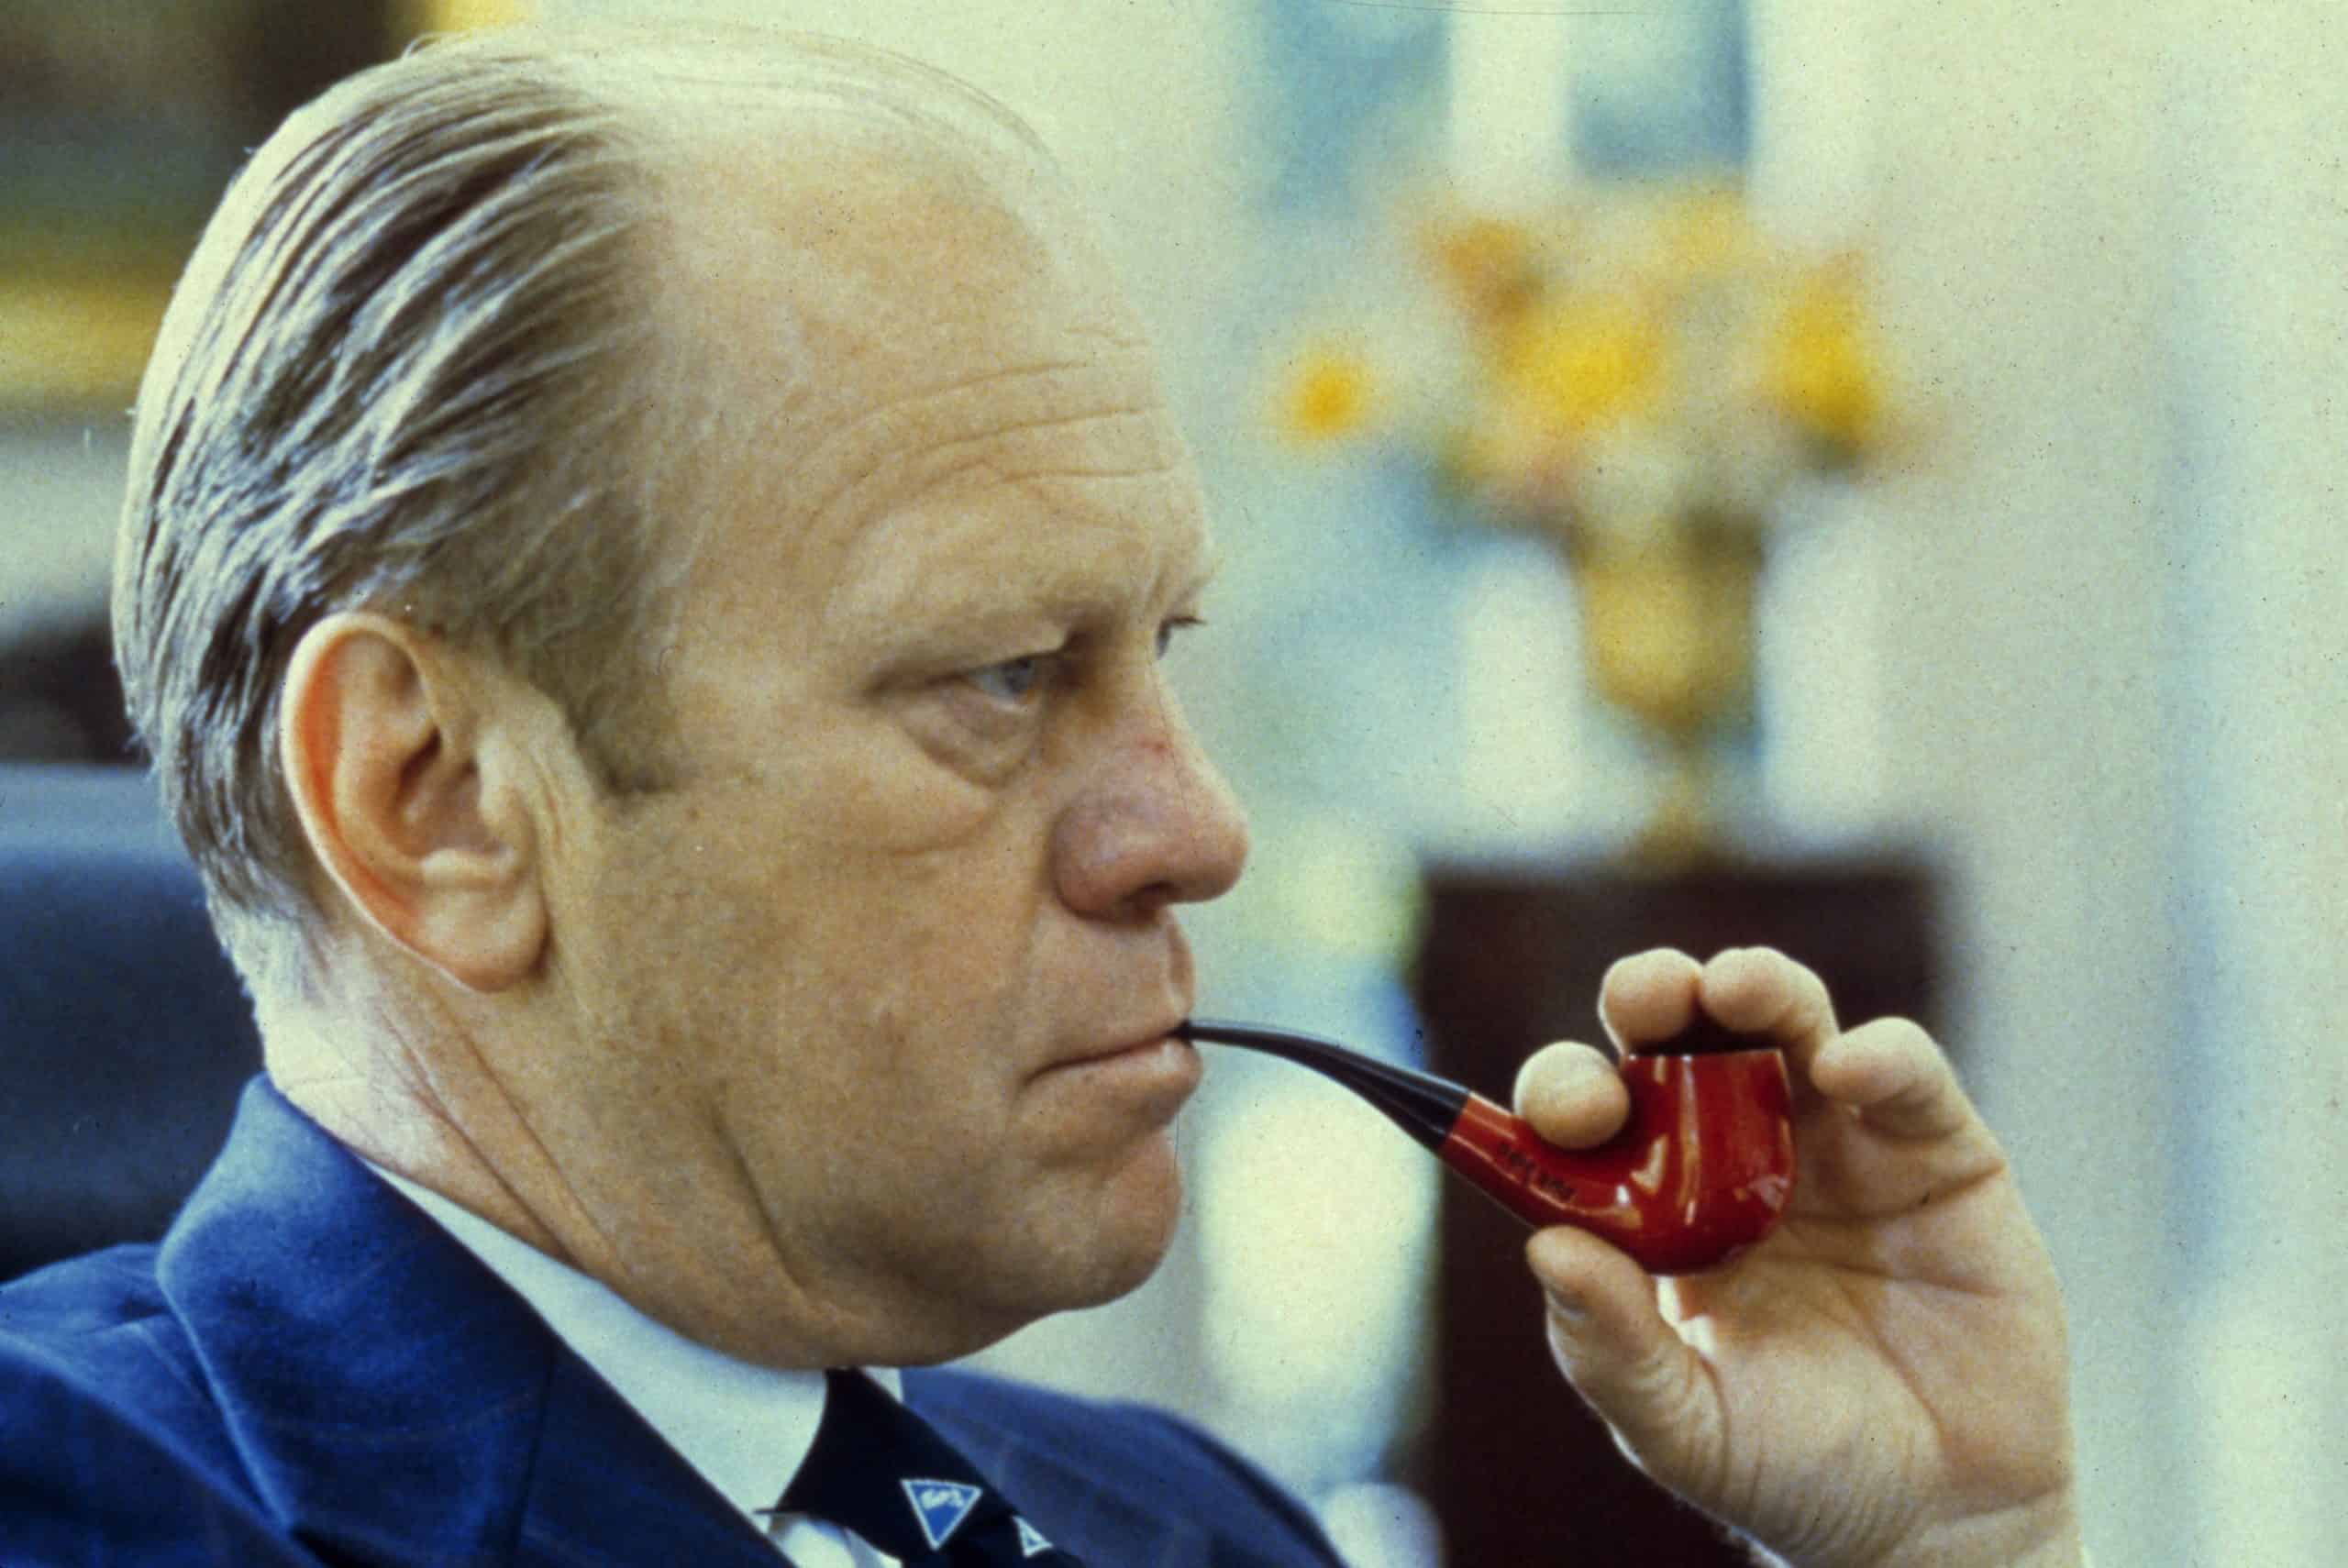
- Net change in employment during presidency: +2,906,000 jobs
- Avg. annual change in employment during presidency: +1.1% (+1,453,000 jobs)
- Net change in labor force during presidency: +2,383,000 Americans
- Avg. annual unemployment rate during presidency: 8.1%
- Lowest and highest annual unemployment rate: 7.7% in 1976; 8.5% in 1975
- Party affiliation: Republican
9. Dwight Eisenhower (in office from Jan. 1953 – Jan. 1961)

- Net change in employment during presidency: +4,599,000 jobs
- Avg. annual change in employment during presidency: +1.1% (+574,875 jobs)
- Net change in labor force during presidency: +6,613,000 Americans
- Avg. annual unemployment rate during presidency: 4.9%
- Lowest and highest annual unemployment rate: 2.9% in 1953; 6.8% in 1958
- Party affiliation: Republican
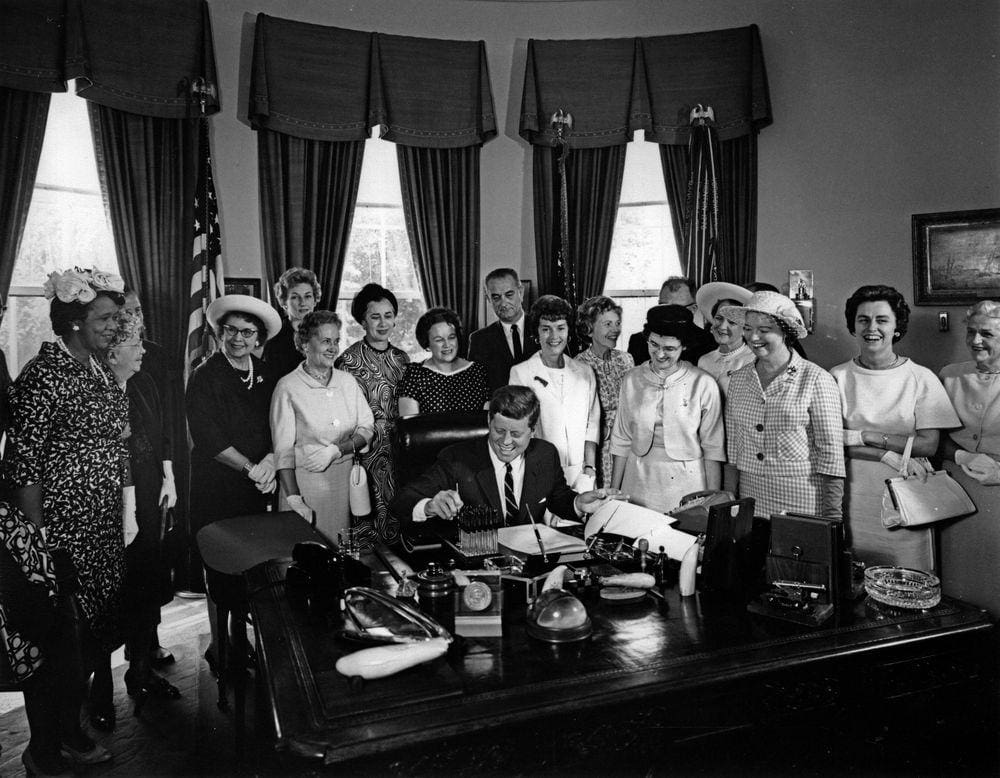
8. Lyndon Johnson (in office from Nov. 1963 – Jan. 1969)
 and President Lyndon B. Johnson by Yoichi Okamoto, July 19, 1968 (NARA) by pingnews.com")
- Net change in employment during presidency: +6,615,000 jobs
- Avg. annual change in employment during presidency: +2.3% (+1,323,000 jobs)
- Net change in labor force during presidency: +5,646,000 Americans
- Avg. annual unemployment rate during presidency: 4.2%
- Lowest and highest annual unemployment rate: 3.6% in 1968; 5.2% in 1964
- Party affiliation: Democratic
7. Jimmy Carter (in office from Jan. 1977 – Jan. 1981)
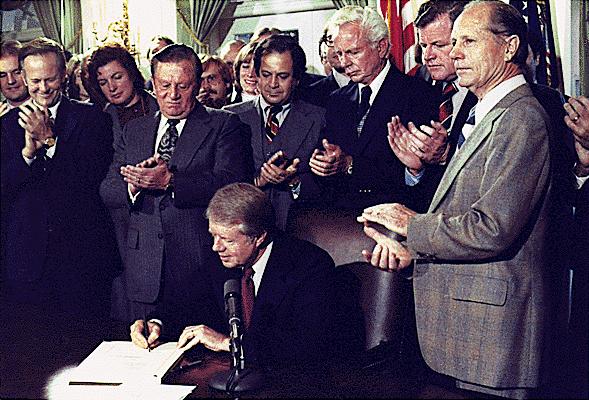
- Net change in employment during presidency: +7,286,000 jobs
- Avg. annual change in employment during presidency: +2.9% (+1,821,500 jobs)
- Net change in labor force during presidency: +7,931,000 Americans
- Avg. annual unemployment rate during presidency: 6.5%
- Lowest and highest annual unemployment rate: 5.8% in 1979; 7.1% in 1977 and 1980
- Party affiliation: Democratic
6. George W. Bush (in office from Jan. 2021 – Jan. 2009)
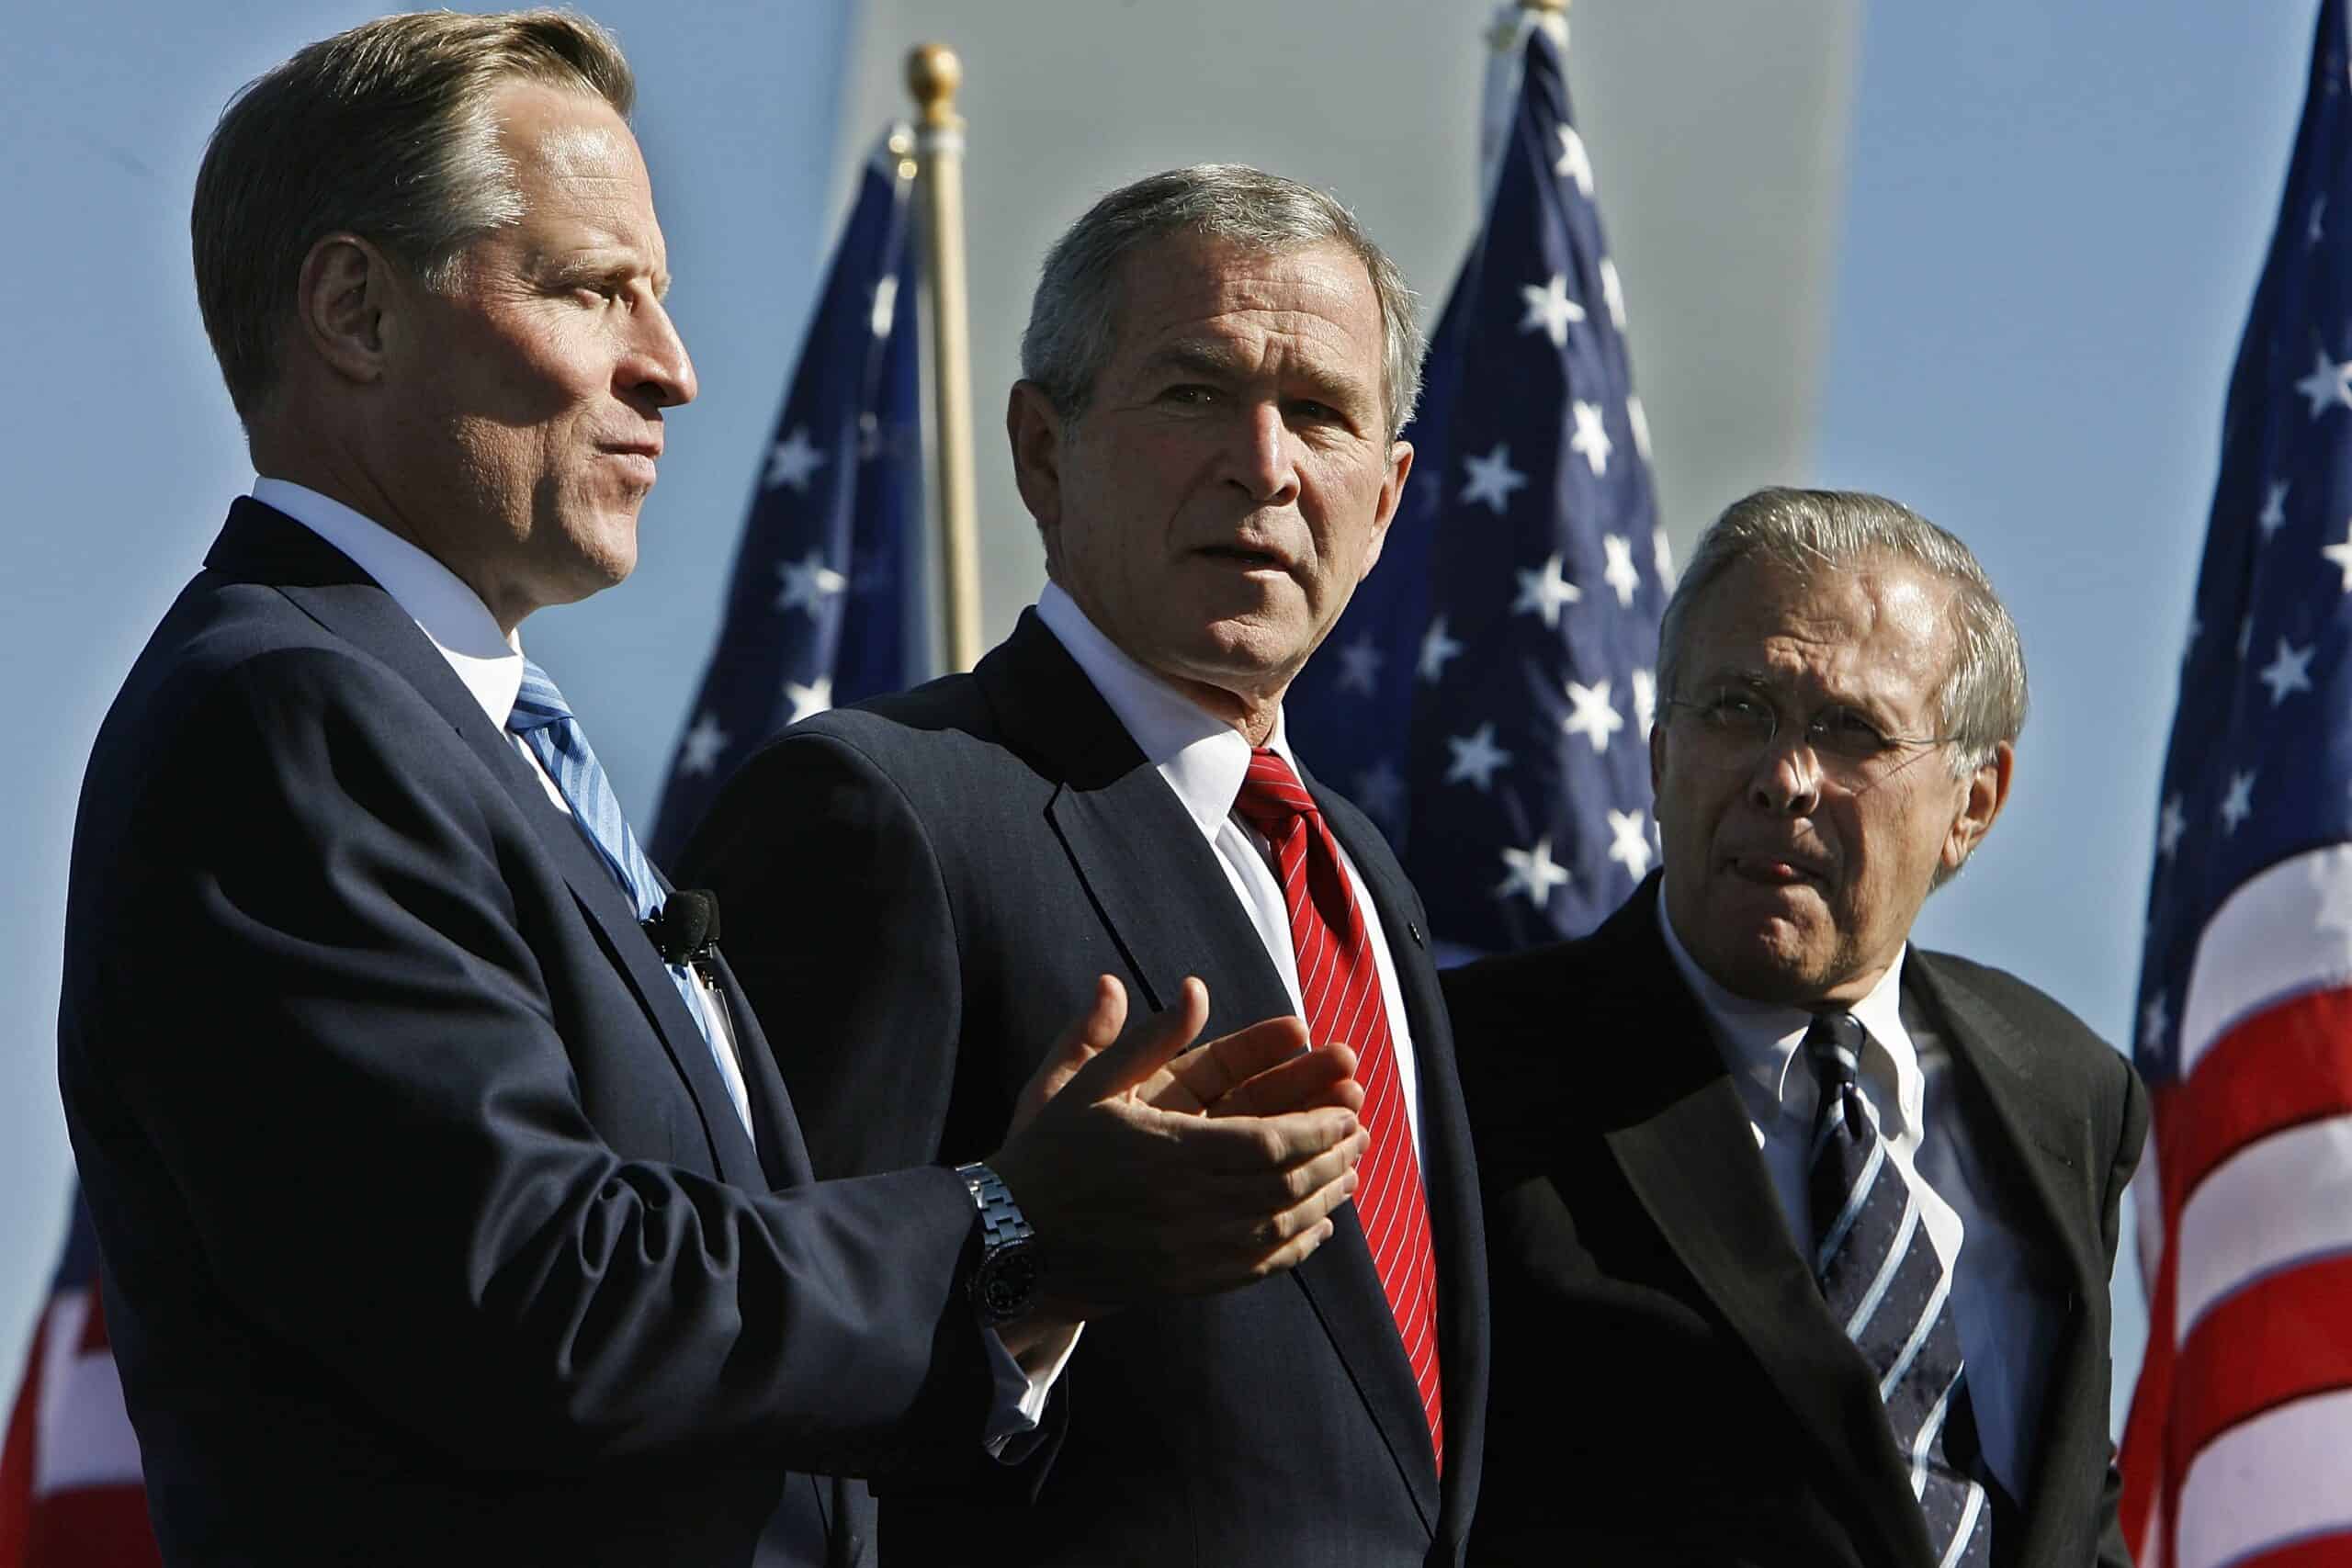
- Net change in employment during presidency: +8,429,000 jobs
- Avg. annual change in employment during presidency: +0.8% (+1,053,625 jobs)
- Net change in labor force during presidency: +10,553,000 Americans
- Avg. annual unemployment rate during presidency: 5.3%
- Lowest and highest annual unemployment rate: 4.6% in 2006 and 2007; 6.0% in 2003
- Party affiliation: Republican
5. Joe Biden (in office from Jan. 2021 – Present)

- Net change in employment during presidency: +8,456,000 jobs
- Avg. annual change in employment during presidency: +2.9% (+2,818,667 jobs)
- Net change in labor force during presidency: +5,912,000 Americans
- Avg. annual unemployment rate during presidency: 4.2%
- Lowest and highest annual unemployment rate: 3.6% in 2022 and 2023; 5.3% in 2021
- Party affiliation: Democratic
4. Richard Nixon (in office from Jan. 1969 – Aug. 1974)

- Net change in employment during presidency: +8,892,000 jobs
- Avg. annual change in employment during presidency: +2.3% (+1,482,000 jobs)
- Net change in labor force during presidency: +11,215,000 Americans
- Avg. annual unemployment rate during presidency: 5.1%
- Lowest and highest annual unemployment rate: 3.5% in 1969; 5.9% in 1971
- Party affiliation: Republican
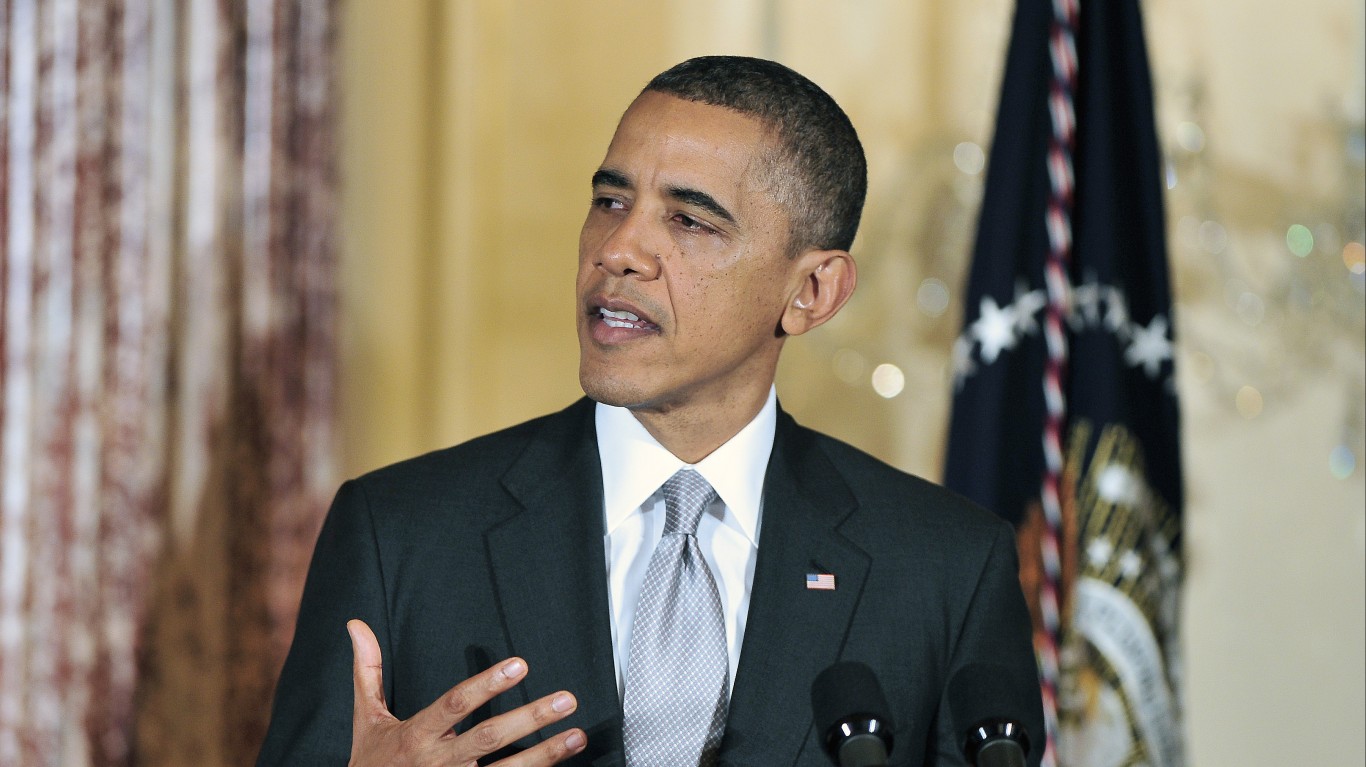
3. Barack Obama (in office from Jan. 2009 – Jan. 2017)
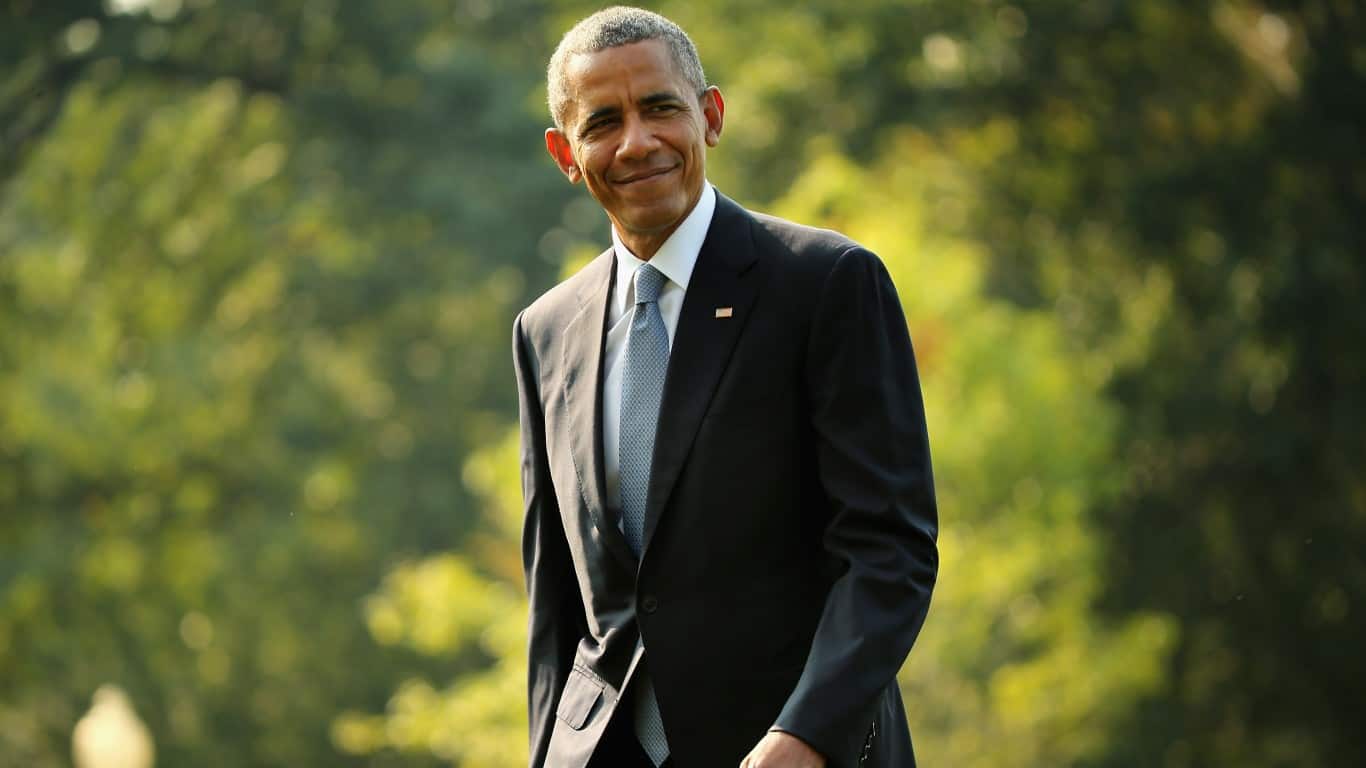
- Net change in employment during presidency: +11,559,000 jobs
- Avg. annual change in employment during presidency: +0.5% (+1,444,875 jobs)
- Net change in labor force during presidency: +5,045,000 Americans
- Avg. annual unemployment rate during presidency: 7.4%
- Lowest and highest annual unemployment rate: 4.9% in 2016; 9.6% in 2010
- Party affiliation: Democratic
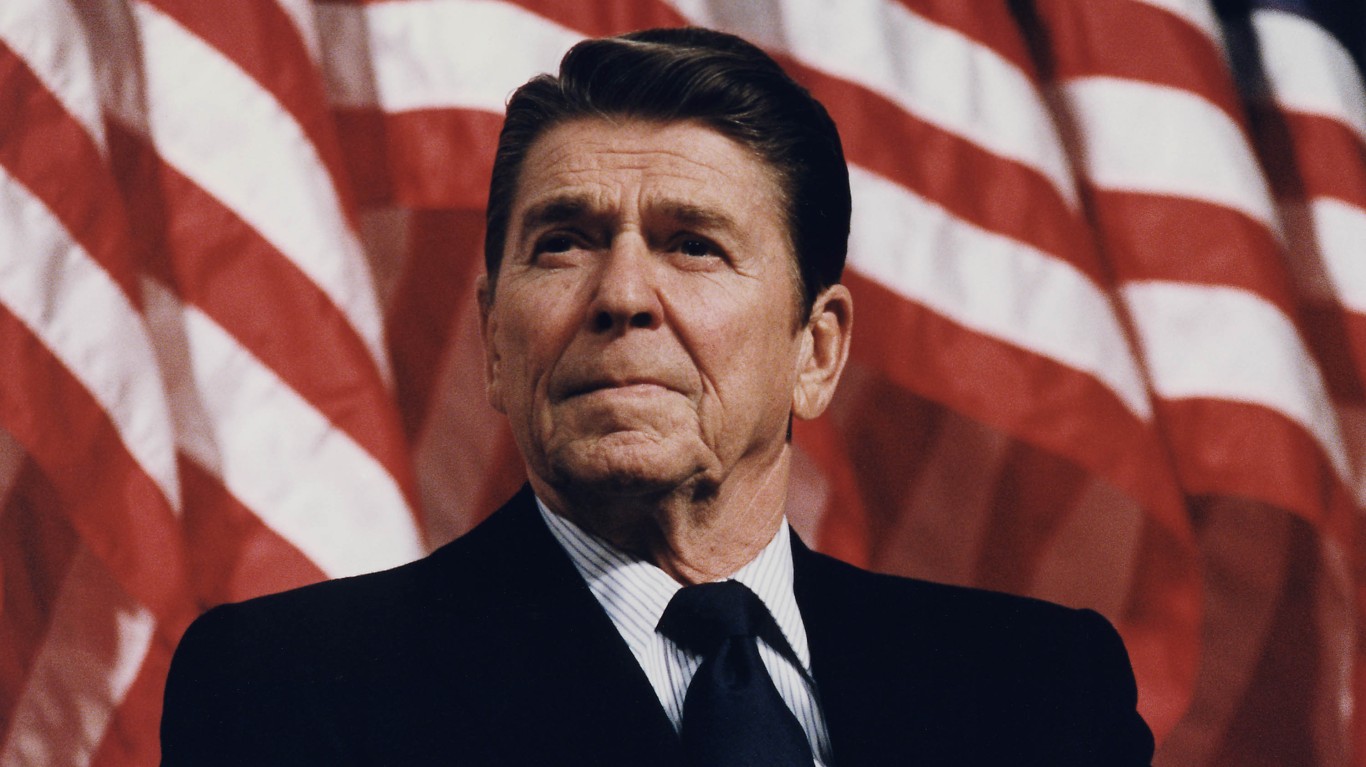
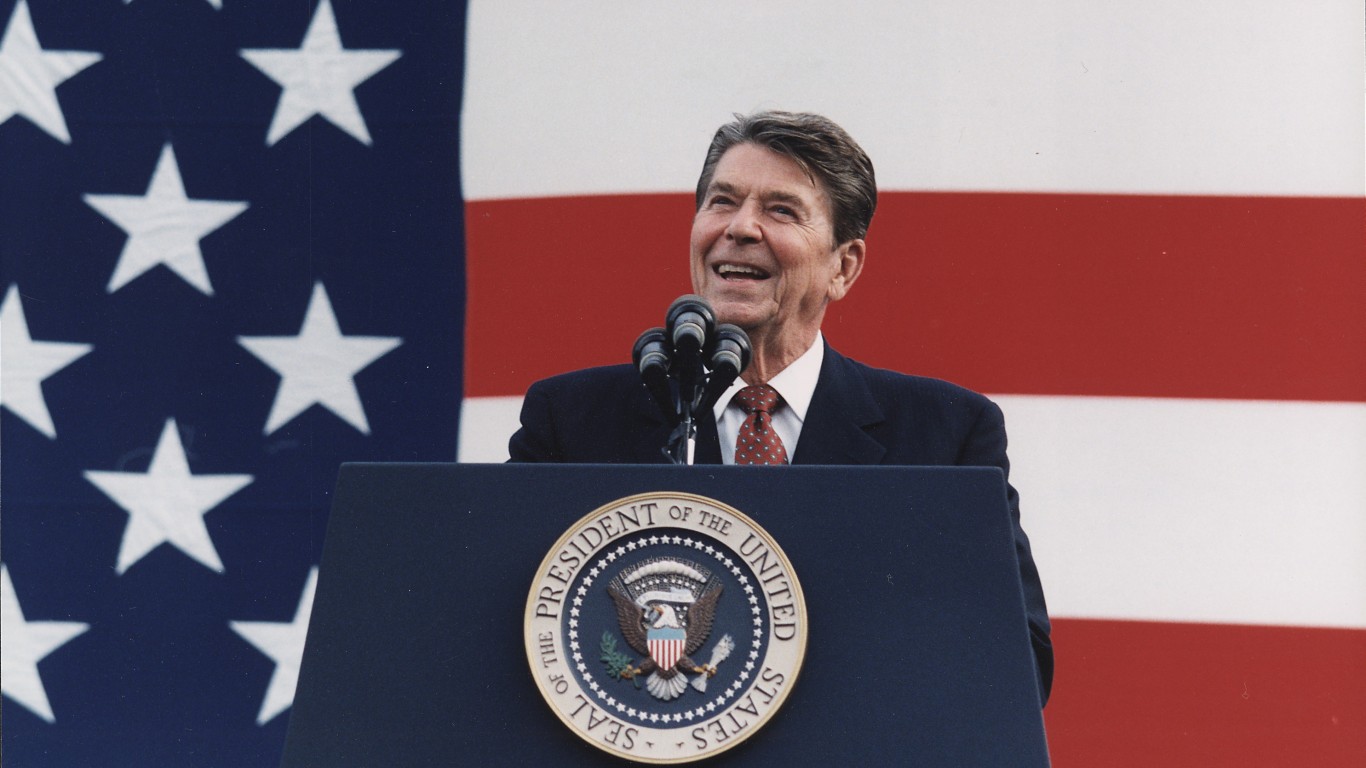
2. Ronald Reagan (in office from Jan. 1981 – Jan. 1989)

- Net change in employment during presidency: +14,571,000 jobs
- Avg. annual change in employment during presidency: +1.9% (+1,821,375 jobs)
- Net change in labor force during presidency: +12,999,000 Americans
- Avg. annual unemployment rate during presidency: 7.5%
- Lowest and highest annual unemployment rate: 5.5% in 1988; 9.7% in 1982
- Party affiliation: Republican
1. Bill Clinton (in office from Jan. 1993 – Jan. 2001)
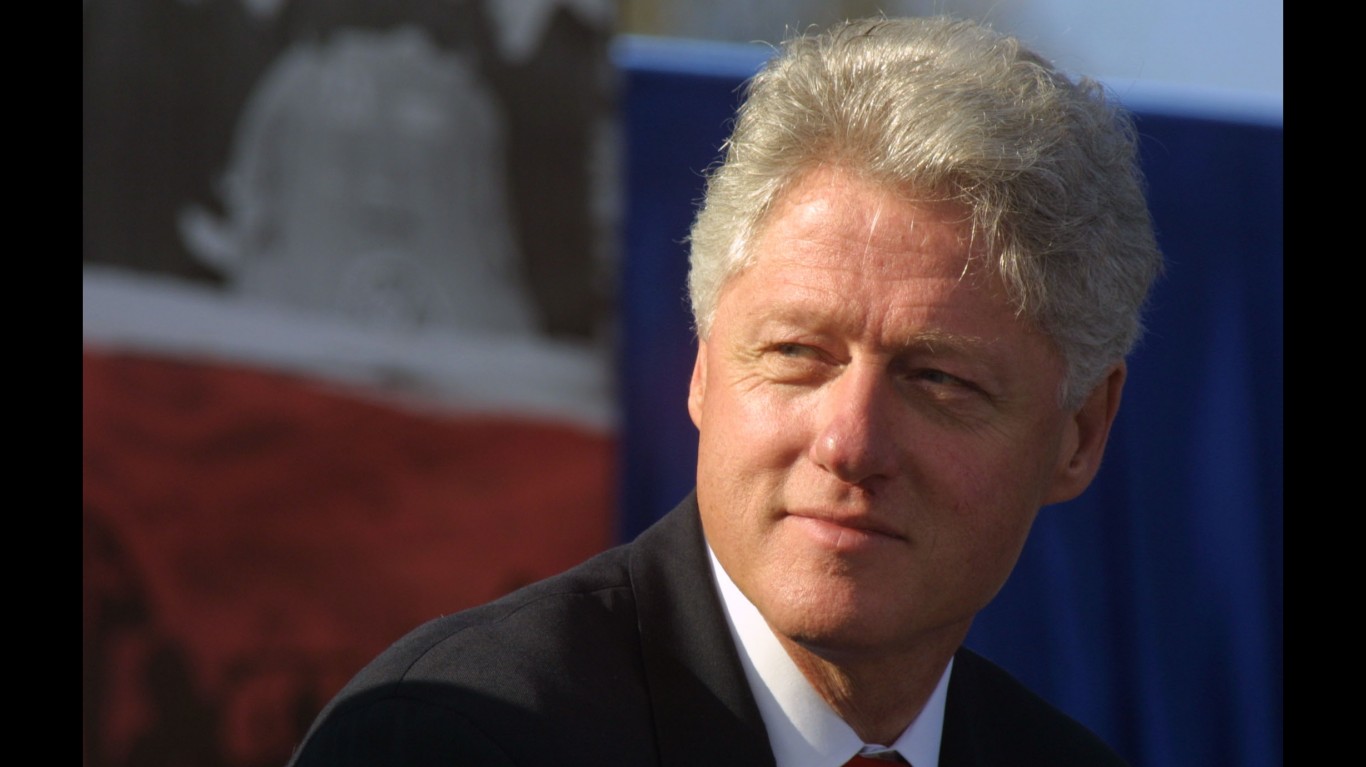
- Net change in employment during presidency: +16,632,000 jobs
- Avg. annual change in employment during presidency: +1.8% (+2,079,000 jobs)
- Net change in labor force during presidency: +13,383,000 Americans
- Avg. annual unemployment rate during presidency: 5.2%
- Lowest and highest annual unemployment rate: 4.0% in 2000; 6.9% in 1993
- Party affiliation: Democratic