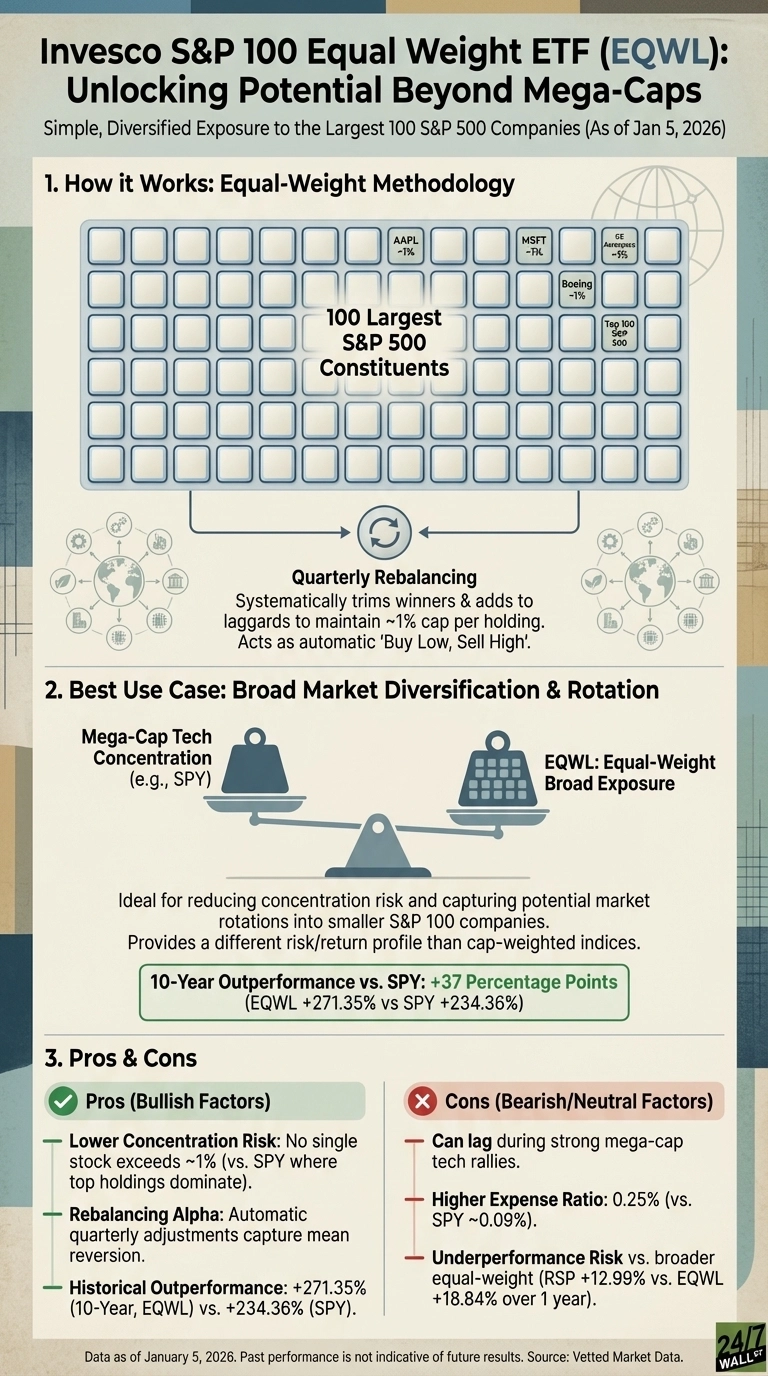
The S&P 500 has a concentration problem. At the start of 2026, the top seven stocks account for roughly a third of the market-cap weighted index, leaving investors heavily exposed to a handful of mega-cap technology companies. Invesco S&P 100 Equal Weight ETF (NYSEARCA:EQWL) offers a different approach: it takes the 100 largest companies in the S&P 500 and gives each equal weight, capping even giants like Apple Inc. (NASDAQ:AAPL | AAPL Price Prediction) and Microsoft Corporation (NASDAQ:MSFT) at roughly 1% of the portfolio.
With nearly 20 years of history since its December 2006 inception, EQWL has delivered impressive results. The ETF returned 271% over the past decade compared to 234% for the market-cap weighted SPDR S&P 500 ETF Trust (NYSEARCA:SPY), a 37 percentage point advantage. More recently, EQWL gained 18.84% over the past year versus 17.34% for SPY, and it’s up 1.07% in early 2026 while SPY has gained just 0.85%. The strategy works by rebalancing quarterly, systematically trimming winners and adding to laggards.
The Macro Factor: Market Breadth and Rotation Dynamics
Equal-weight strategies thrive when market leadership broadens beyond mega-caps. Early 2026 signals suggest this rotation may be underway. The iShares Russell 2000 ETF (NYSEARCA:IWM) has gained 2.67% year-to-date while the tech-heavy Invesco QQQ Trust (NASDAQ:QQQ) has posted a modest 0.60% gain. This divergence indicates investors are seeking exposure beyond the mega-cap names that dominated 2023 and 2024.
Watch for continued shifts in market breadth by comparing equal-weight indices to their market-cap counterparts. When the gap narrows or reverses, equal-weight strategies benefit. Historical data from Invesco Ltd. (NYSE:IVZ) shows equal-weight versions of the S&P 500 outperformed market-cap weighted versions by an average of 1.05% annually over multi-decade periods. Monitor this monthly through index provider reports from S&P Dow Jones Indices and track the relative performance of RSP versus SPY as a real-time gauge.
The Micro Factor: Quarterly Rebalancing Mechanics
EQWL’s quarterly rebalancing creates a systematic buy-low, sell-high mechanism. When a stock rallies beyond its 1% target weight, the fund trims the position. When a stock lags below 1%, the fund adds shares. This disciplined approach removes emotion and captures mean reversion opportunities that market-cap indices miss.
The fund’s current sector allocation reflects this balance: Financials at 17.3%, Information Technology at 16.3%, and Healthcare at 15.2%. Compare this to market-cap weighted indices where Technology often exceeds 30%. Check Invesco’s monthly fact sheet for EQWL to monitor sector drift between rebalances and review the quarterly holdings file to see which positions were trimmed or increased.
Alternative Worth Considering
For a broader approach, consider Invesco S&P 500 Equal Weight ETF (NYSEARCA:RSP). It applies the same equal-weight methodology but spreads exposure across all 500 companies rather than just the top 100. RSP offers greater diversification into mid-cap names and has a longer track record, though it has underperformed EQWL recently, gaining 13% over the past year compared to EQWL’s 18.84%.
Bottom Line
Over the next 12 months, watch for continued market breadth expansion as the macro signal and monitor EQWL’s quarterly rebalancing activity as the micro signal that determines whether this equal-weight approach continues delivering its historical edge.