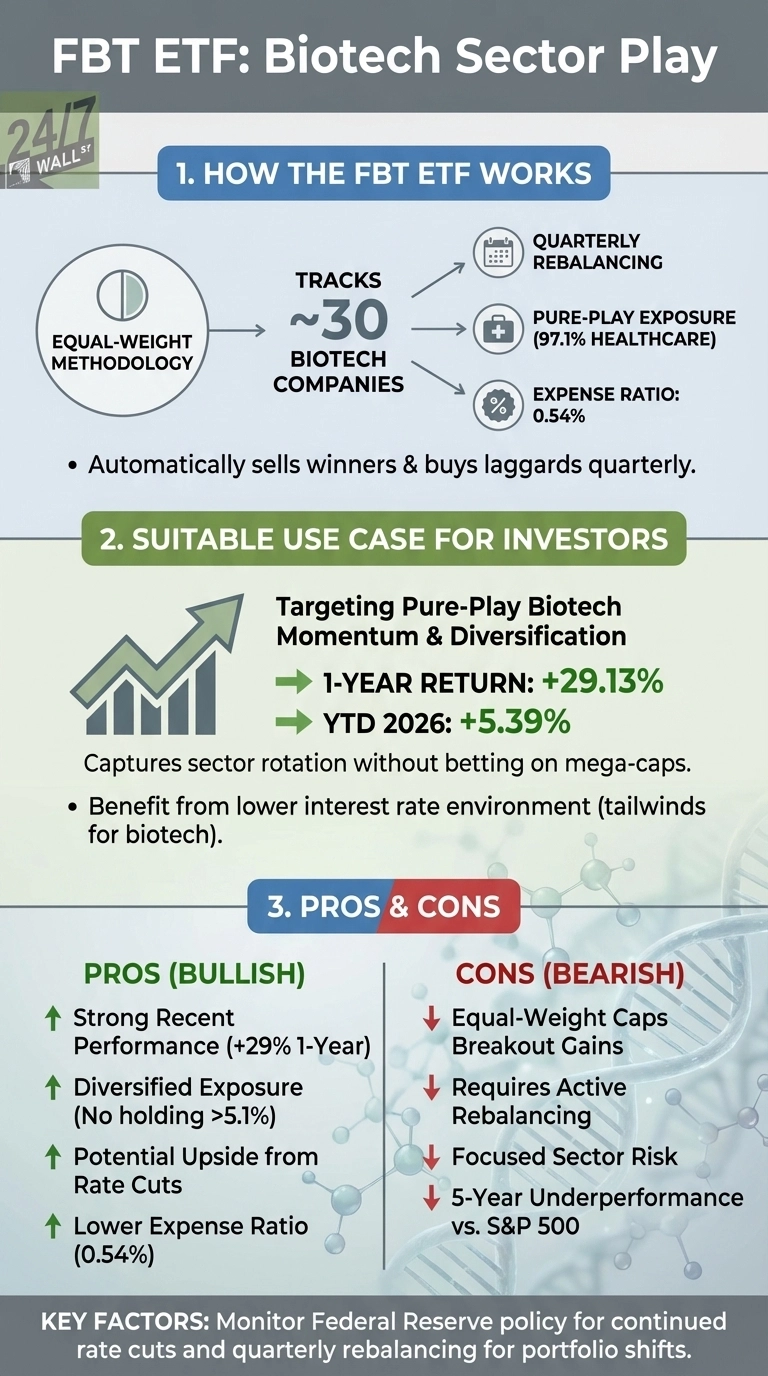
Biotech investors spent years waiting for the sector to recover from its brutal 2021 peak. That patience is finally paying off. First Trust NYSE Arca Biotechnology Index Fund (NYSEARCA:FBT) has surged 29% over the past year, nearly doubling the S&P 500’s return. The ETF’s 5.4% gain in the first week of 2026 suggests momentum isn’t slowing.
FBT tracks about 30 biotechnology companies using an equal-weight methodology, rebalancing quarterly. This approach gives investors diversified exposure across genomics leaders like Exact Sciences (NASDAQ:EXAS | EXAS Price Prediction) (up 76% in the past year), established players like Regeneron (NASDAQ:REGN) (up 13%), and beaten-down names like Moderna (NASDAQ:MRNA) (up 20% in the first week of 2026 alone). With a 0.54% expense ratio and $1.4 billion in assets, it offers pure-play biotech exposure without betting on a handful of mega-caps.
Why Interest Rates Matter More Than FDA Calendars
The biggest tailwind for biotech in 2026 isn’t any single drug approval. It’s the interest rate environment. After the Federal Reserve cut rates three times in 2025, some officials are forecasting another 150 basis points of cuts this year. Lower borrowing costs directly benefit biotech companies, which often burn cash for years before generating profits.
Janus Henderson portfolio managers noted in their 2026 outlook that healthcare stocks are trading at some of the lowest relative valuations in the sector’s history. After years of policy uncertainty weighing on the space, fundamentals are improving while valuations remain depressed. That combination creates room for significant upside when investor sentiment shifts, which appears to be happening now.
Watch the Federal Reserve’s quarterly rate decisions and monthly employment reports. If inflation continues moderating while the labor market softens, additional rate cuts become more likely. Each cut makes it cheaper for biotech firms to fund clinical trials and commercialization.
Equal Weighting Creates Opportunity and Risk
FBT’s equal-weight structure means every holding gets roughly 3% to 5% allocation, regardless of market cap. This differs from market-cap-weighted funds that concentrate heavily in mega-cap pharma. The quarterly rebalancing automatically sells winners and buys laggards, which can boost returns during sector rotations but also caps gains from breakout performers.
Investors should review FBT’s holdings file after each quarterly rebalance (January, April, July, October) on First Trust’s website. Companies entering or exiting the index can signal shifting sector leadership.
Consider XBI for Broader Exposure
The SPDR S&P Biotech ETF (NYSEARCA:XBI) offers a compelling alternative with $8.3 billion in assets, a lower 0.35% expense ratio, and exposure to over 150 biotech stocks instead of 30. The broader diversification reduces single-stock risk while maintaining equal-weight benefits.
The key factors for 2026: watch Federal Reserve policy for continued rate cuts, and monitor FBT’s quarterly rebalancing for portfolio shifts that signal where smart money is rotating within biotech.