Reddit Is Still Furious About AT&T’s $47 Billion Loss From Six Years Ago

Photo of David Beren
By David Beren Published

Quick Read

  • AT&T (T) lost $47B on media assets sold in 2022. The Ellison family now acquires those assets for $111B.

  • AT&T operating income fell 7.25% to $6.1B in Q3 2025 despite fiber broadband revenue growing 16.8%.

  • AT&T’s Advanced Connectivity segment produces 95% of EBITDA and grows at 6% annually versus 3% consolidated.

This post may contain links from our sponsors and affiliates, and Flywheel Publishing may receive compensation for actions taken through them.
Reddit Is Still Furious About AT&T’s $47 Billion Loss From Six Years Ago

© jetcityimage / iStock Editorial via Getty Images

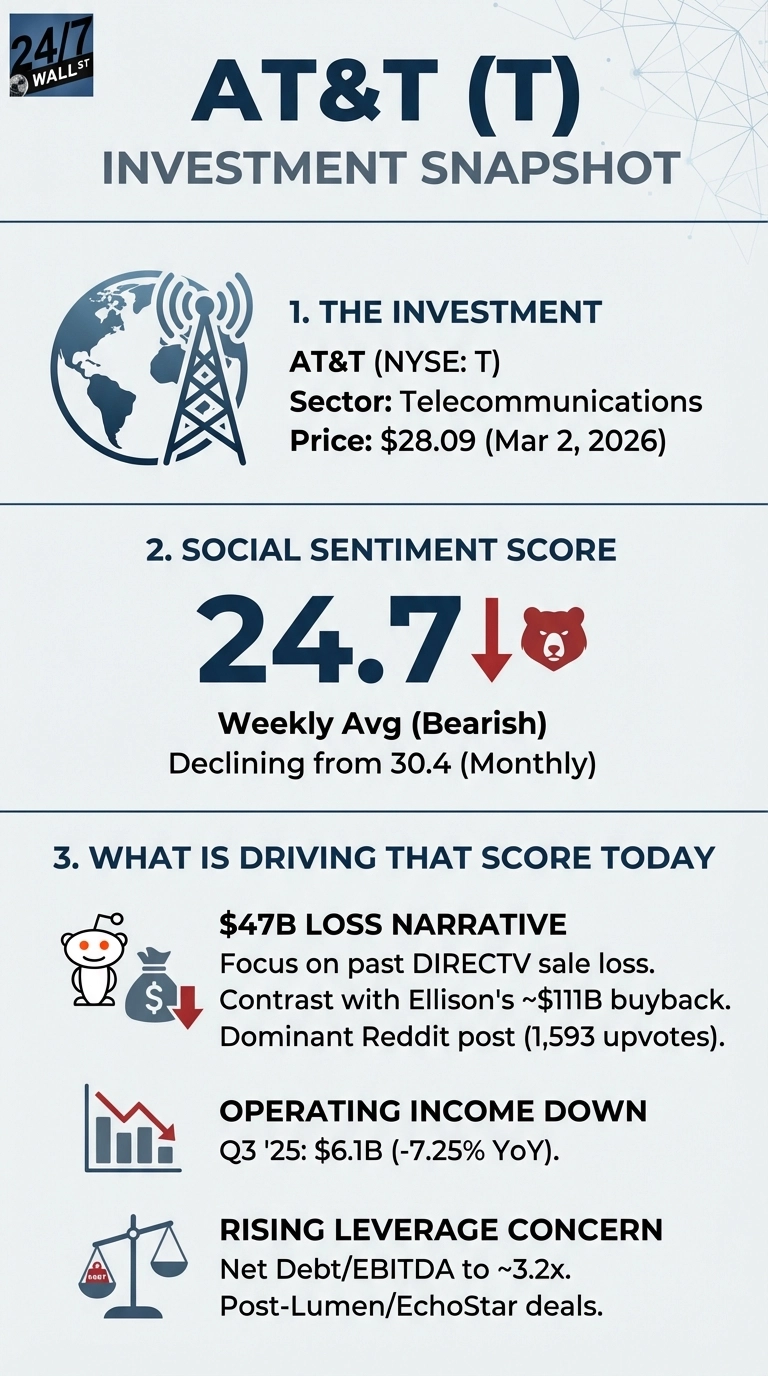
Still one of the biggest names in telecom, AT&T (NYSE:T | T Price Prediction) trades at $27.98 as of Monday early afternoon, up 12% year-to-date but down 1.8% over the past week. Retail sentiment on Reddit has slid from a monthly average of 30.4 to a weekly average of 24.7, keeping AT&T in bearish territory. The conversation isn’t about fiber or wireless. It’s about a $47 billion mistake Reddit won’t let management forget.

The Ellison Deal Reopens AT&T’s Worst Trade

One post is driving nearly all of AT&T’s social activity this week. On r/wallstreetbets, user osiris_rai published “AT&T Lost $47B on This Exact Bundle—Now the Ellisons Are Buying It Back for $111B. Bold Move or Billionaire Ego Trip?” It drew 1,647 upvotes with a 97% upvote ratio and 267 comments.

“AT&T acquired the bundle for $108.7 billion in 2018 and exited for roughly $43 billion in 2022, booking a $47 billion loss in the process. The Ellison family is now paying $111 billion for those same assets, backed by $57.5 billion in debt from Bank of America, Citigroup, and Apollo. Bold move or billionaire ego trip?”
AT&T Lost $47B on This Exact Bundle—Now the Ellisons Are Buying It Back for $111B. Bold Move or Billionaire Ego Trip?
by u/osiris_rai in wallstreetbets


The math: AT&T acquired DirecTV for $49 billion in 2015 and exited for $7.6 billion in 2025, booking a $32.8 billion loss in the process. TPG Capital now owns the asset outright after acquiring AT&T’s remaining 70% stake on July 2, 2025, following its initial 30% investment in 2021. The bearish case retail investors are building rests on three pillars:
 
An infographic titled 'AT&T (T) Investment Snapshot' with a blue and white color scheme. Section 1, 'The Investment,' shows a globe and transmission tower icon, stating AT&T (NYSE: T), Sector: Telecommunications, Price: $28.09 (Mar 2, 2026). Section 2, 'Social Sentiment Score,' displays a large '24.7' with a red down arrow and a red bear icon, indicating 'Weekly Avg (Bearish)' and 'Declining from 30.4 (Monthly)'. Section 3, 'What is Driving That Score Today,' lists three factors with accompanying icons: '1. $47B LOSS NARRATIVE' with a Reddit alien and money bag with a down arrow, detailing 'Focus on past DIRECTV sale loss. Contrast with Ellison's ~$111B buyback. Dominant Reddit post (1,593 upvotes).' '2. OPERATING INCOME DOWN' with a bar chart and red down arrow, stating 'Q3 '25: $6.1B (-7.25% YoY).' '3. RISING LEVERAGE CONCERN' with a balance scale icon with 'DEBT' on one side, stating 'Net Debt/EBITDA to ~3.2x. Post-Lumen/EchoStar deals.'
24/7 Wall St.
This infographic details AT&T’s current bearish social sentiment score of 24.7, declining from a monthly average of 30.4 as of March 2, 2026. Key drivers include a $47 billion DIRECTV loss narrative, a drop in operating income, and rising leverage concerns.
  • AT&T’s history of acquiring media assets at peak prices makes its current $23 billion EchoStar spectrum purchase harder to evaluate with confidence
  • Operating income fell 7.25% year-over-year to $6.1 billion in Q3 2025, even as headline net income surged on the one-time DIRECTV gain
  • The pending Lumen acquisition will push net debt to adjusted EBITDA to approximately 3.0x before deleveraging begins
 

What the Actual Segment Data Shows

As far as AT&T results go, consumer fiber broadband revenue grew 16.8% year-over-year to $2.2 billion in Q3 2025, and AT&T ended 2025 with over one million fiber net adds for the eighth consecutive year. The convergence rate for customers subscribing to both fiber and wireless climbed 200 basis points year-over-year to 42% in Q4 2025.

Starting with Q1 2026 results, AT&T restructures into two segments: Advanced Connectivity (domestic 5G and fiber) and Legacy (covering copper-based services). Advanced Connectivity represented roughly 90% of revenues and over 95% of adjusted EBITDA in 2025, growing EBITDA at more than 3% annually. 

The consensus price target sits at $29.41, though Wells Fargo recently trimmed its target from $29 to $27. The stock trades at roughly 9x trailing earnings with a 4% dividend yield, and if the Advanced Connectivity numbers print cleanly and the Lumen integration stays on track, AT&T gets a chance to reframe the conversation away from its media-era missteps.

Photo of David Beren
About the Author David Beren →

David Beren has been a Flywheel Publishing contributor since 2022. Writing for 24/7 Wall St. since 2023, David loves to write about topics of all shapes and sizes. As a technology expert, David focuses heavily on consumer electronics brands, automobiles, and general technology. He has previously written for LifeWire, formerly About.com. As a part-time freelance writer, David’s “day job” has been working on and leading social media for multiple Fortune 100 brands. David loves the flexibility of this field and its ability to reach customers exactly where they like to spend their time. Additionally, David previously published his own blog, TmoNews.com, which reached 3 million readers in its first year. In addition to freelance and social media work, David loves to spend time with his family and children and relive the glory days of video game consoles by playing any retro game console he can get his hands on.

Featured Reads

Our top personal finance-related articles today. Your wallet will thank you later.

Continue Reading

Top Gaining Stocks

DDOG Vol: 21,676,191
FTNT Vol: 14,409,681
AXON Vol: 1,959,677
PAYC Vol: 1,399,243
PTC
PTC Vol: 2,340,942

Top Losing Stocks

ZTS Vol: 24,596,040
TPR Vol: 4,699,146
TER Vol: 2,619,448
CTRA Vol: 73,319,495
JBL Vol: 1,098,644