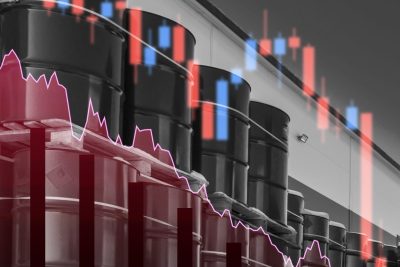
While the S&P 500 has slipped roughly 4% over the past month, two natural gas ETFs have quietly put up some of the strongest returns in the market. The story behind that divergence comes down to one extraordinary event in late January and what it reveals about natural gas as a portfolio diversifier when equity markets turn choppy.
What Happened in January Changed the YTD Math
Henry Hub natural gas spot prices spiked to $30.72 per million BTU on January 23, 2026, a dramatic surge from the $2.82 low reached in early January. That kind of move in an energy commodity does not happen quietly. It flows directly into funds structured around natural gas exposure, and it created a performance gap between energy-linked ETFs and broad equity indexes that is still visible today.
Prices have since normalized, trading around $3.25 per million BTU as of March 9, but the gains captured during the spike are locked into year-to-date returns. Meanwhile, the VIX has climbed to 27.29, up over 53% in the past month, signaling the kind of broad market anxiety that historically pushes investors toward assets with low correlation to equities.
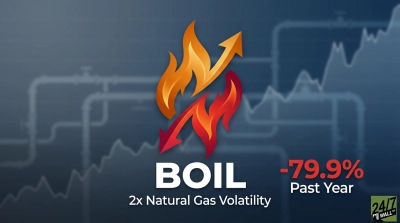
BWET: The Amplify Natural Gas ETF Built for Volatility
BWET has been the standout performer in this environment, surging 27.5% over the past month and 209% year to date — a direct result of its structure capturing the January commodity spike. That is what happens when a fund designed to capture natural gas price movements catches a historic commodity spike at the right moment. Its 3.5% net expense ratio reflects the real cost of managing commodity-linked exposure.
The tradeoff is straightforward: the same volatility that produced those year-to-date gains works in both directions. Natural gas is one of the most volatile commodities in the world, and a fund that surges when prices spike will give back gains quickly when prices normalize. The cost structure and commodity-linked nature of BWET reflect a fund designed around shorter-term natural gas price movements rather than long-term passive holding. The one-week return of 3.6% reflects a market still digesting the post-January normalization, and the fund continues to trade at levels reflecting the post-January normalization.
UNG: The Straightforward Natural Gas Bet With a Long Track Record
The United States Natural Gas Fund, better known as UNG, is the most widely recognized natural gas ETF in the market. With $422.8 million in net assets and a history stretching back to April 2007, it offers the liquidity and institutional familiarity that BWET, as a newer and smaller fund, cannot match.
UNG is up roughly 12% over the past month. That is a more modest result than BWET, but still a meaningful positive return at a time when the S&P 500 is down. Year-to-date gains of 3% tell a similar story: steady participation in the commodity move without the amplified swings of a leveraged structure. The fund holds natural gas futures contracts, which means its performance tracks the commodity directly rather than through equity proxies like producers or pipeline operators.
The expense ratio of 1.24% is far lower than BWET’s, which matters for investors sizing a position over a longer holding period. But the more important caveat with UNG is contango. When futures markets are in contango (meaning the next contract is priced higher than the current one), rolling from one contract to the next creates a persistent drag on returns. This is why UNG’s one-year return is down 41% even as spot natural gas prices swung from under $3 to over $30 and back during the same period. UNG offers the deepest liquidity among natural gas ETFs, though the structural drag from futures rolling has historically eroded long-term returns.
A Third Angle: Natural Gas Producers via FCG
Investors who want exposure to rising natural gas prices without the futures-roll drag of UNG or the concentrated volatility of BWET have a third option in the First Trust Natural Gas ETF, ticker FCG. This fund holds equities rather than futures, focusing on companies that explore for and produce natural gas. When commodity prices rise, these companies see their profit margins expand, and their stock prices tend to follow.
The equity structure means FCG behaves differently from the commodity itself. It will not spike 200% in a year the way BWET can during an extreme event, but it also avoids the structural decay that comes with futures rolling. Producer stocks carry their own risks, including operational execution, balance sheet quality, and broader equity market sentiment, which is why FCG tends to show more correlation with the S&P 500 than either BWET or UNG do during periods of broad market stress.
FCG provides equity-based exposure to the natural gas sector for those seeking company fundamentals rather than direct commodity contracts. The tradeoff is that the fund’s returns lag the commodity during sharp, short-term spikes like the one seen in January.
Comparing the Three Funds
These three funds have distinct structural characteristics. BWET is designed around a strong, near-term directional view on natural gas prices and carries significant volatility in either direction. UNG is the most liquid and straightforward way to track the commodity, though the structural cost of rolling futures has historically weighed on returns over longer periods. FCG provides exposure to the natural gas sector through company fundamentals, with less sensitivity to the day-to-day mechanics of futures markets. The current environment has rewarded all three differently, and those structural differences have produced meaningfully different return profiles across the three funds in the current environment.