The S&P 500 is down 1.6% so far in 2026. Meanwhile, emerging markets are up sharply, developed international markets are outperforming, and a decade-long valuation gap between US and non-US equities is finally closing. For US investors who have been almost entirely domestic, this shift is creating a real portfolio decision: how do you get international exposure, and which structure fits your goals?
Three ETFs offer meaningfully different answers: the iShares Core MSCI Emerging Markets ETF (NYSEARCA:IEMG | IEMG Price Prediction), the Fidelity Fundamental Emerging Markets ETF (NYSEARCA:FFEM), and the Fidelity International Value Factor ETF (NYSEARCA:FIVA). Each targets a different slice of the international opportunity.
What’s Driving the Non-US Rally
International equities outperformed US stocks by their largest margin in over 30 years in 2025, and the gap has widened further into 2026. According to Seymour Asset Management, international equities have beaten US equities by roughly 15% since the inflection point in November 2024. The drivers are structural: a weaker US dollar, attractive valuations relative to US mega-cap tech, a pickup in global growth, and increased European defense spending. In January 2026, global equities performed 8 percentage points higher than the S&P 500, the widest gap in three decades, according to Econofact. For US investors who have historically kept international exposure in the 12-15% range, that underweight is now costing real returns.
IEMG: The Passive Core for Emerging Market Exposure
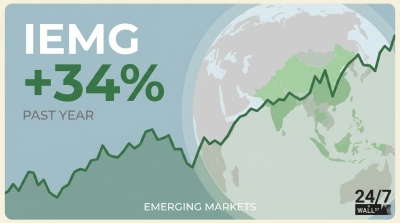
IEMG tracks the MSCI Emerging Markets Investable Market Index, covering large, mid, and small-cap stocks across developing economies. At $148.6 billion in assets, IEMG is one of the largest and cheapest ways to access emerging markets, with an expense ratio of just 0.09%. That low-cost structure has not come at the expense of returns — the fund is up 7.2% year-to-date, and 33% over the past year, reflecting the broad tailwind behind developing economies in 2026.
The fund’s largest holdings — Tencent, Samsung, and HDFC Bank — span the key growth engines of China, India, and South Korea, giving investors diversified exposure to the most dynamic corners of the developing world. With only 6% annual portfolio turnover, this is a genuine buy-and-hold vehicle built for investors comfortable with EM cyclicality. The tradeoff is full emerging market volatility. IEMG fits best as a core holding for investors who want broad, low-cost EM exposure and are comfortable with the cyclicality of developing economies.
FFEM: Active Stock-Picking in Emerging Markets
Launched in November 2024, FFEM is actively managed, using fundamental research to select emerging market stocks rather than tracking an index. The manager screens for quality and valuation rather than buying by market cap weight. That active stance costs more: the expense ratio is 0.60%, compared to IEMG’s 0.09%.
The portfolio concentrates in technology and financials, the two sectors where Fidelity’s analysts see the strongest fundamental cases in emerging markets. Taiwan Semiconductor anchors the fund at 14%, with Tencent and Samsung rounding out a top-heavy but conviction-driven lineup. Geographically, China, Taiwan, South Korea, and India collectively represent over 73% of the portfolio. That focus has paid off — FFEM is up 9.8% year-to-date, outpacing the passive IEMG benchmark. Given its short history, it is too early to call that alpha sustainable, but the fundamental approach gives it a fighting chance when index-heavy names hit turbulence.
FIVA: Developed International With a Value Tilt
FIVA targets large and mid-cap stocks in developed international markets with a deliberate tilt toward undervalued companies. Think Europe and Japan, not China and India. Holdings include ASML, Nestle, Shell, Toyota, Siemens, and Roche across over 100 positions. It carries a 2.3% dividend yield and an expense ratio of 0.18%.
FIVA has been a strong performer across time horizons, up 3.4% year-to-date and 31% over the past year, driven by the value tilt that positions the fund in companies trading at discounts to peers. That same tilt has compounded meaningfully over five years, with the fund returning 75.6% — a reflection of how European industrials and Japanese trading houses have benefited from global infrastructure and commodity themes.
The Tradeoffs Investors Need to Understand
All three funds carry currency risk. Recent dollar weakness has been a tailwind, but that can reverse. Emerging markets carry additional political and liquidity risk, and both IEMG and FFEM have significant China exposure at a time when US-China trade tensions remain elevated.
The cost gap between FFEM and IEMG is meaningful over time. Paying an extra 0.51% annually for active management only makes sense if the manager consistently clears that hurdle, and with less than two years of history, there is not enough track record to know. IEMG suits investors who want low-cost core EM exposure; FFEM suits those who believe active selection adds value in less-efficient markets; and FIVA is the cleaner choice for developed international exposure with a value bias and without the full volatility of emerging economies.