
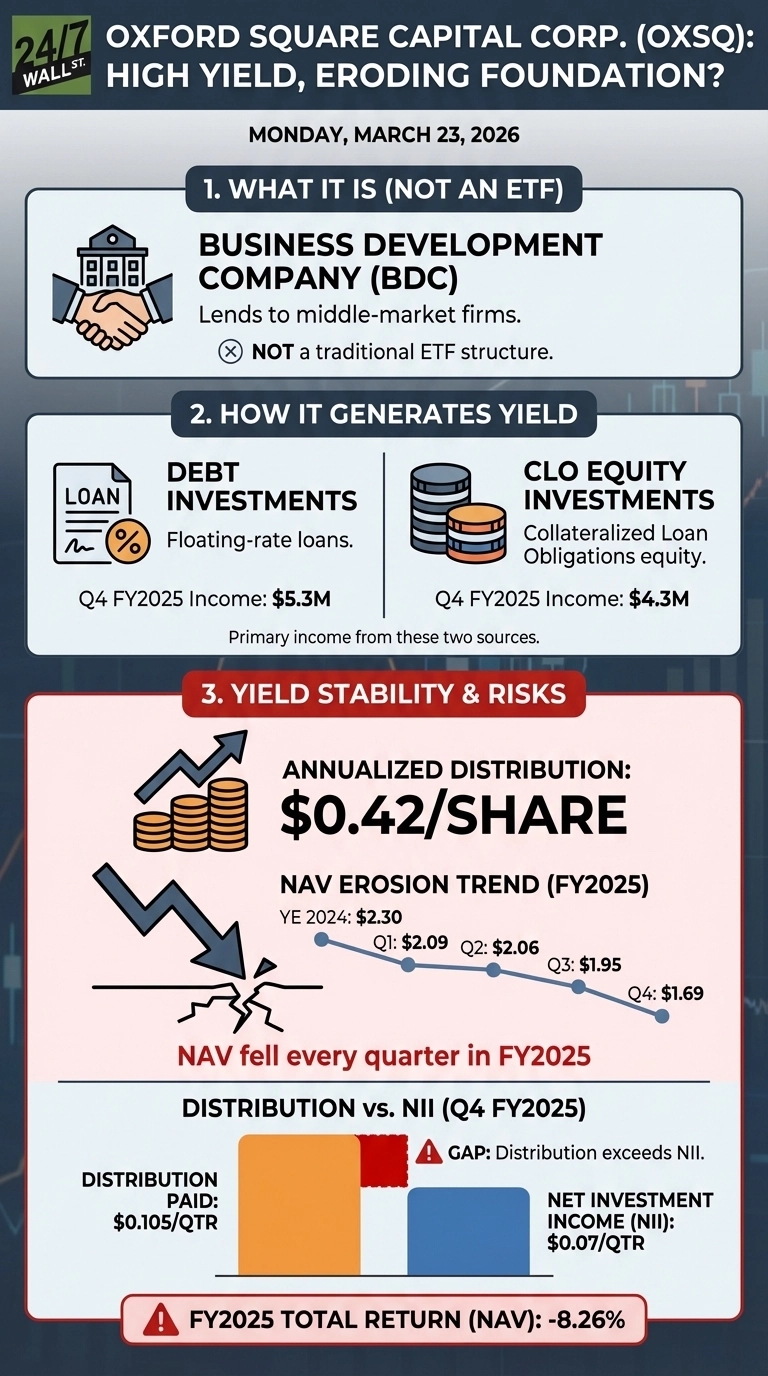
Oxford Square Capital Corp. (NASDAQ:OXSQ) is paying a 24% annualized yield at today’s price, a figure that remains high despite a history of significant distribution cuts, most notably a 48% reduction in 2020. The primary concern for investors today is that the fund’s net asset value (NAV) has fallen every quarter in 2025, dropping 26% from $2.30 to $1.69 per share over the year. When a fund’s NAV erodes faster than distributions accumulate, the yield number flatters a deteriorating picture of the underlying capital.
Two Income Streams, One Structural Problem
Oxford Square is a Business Development Company that lends money to mid-sized companies and passes income through to shareholders. It draws from two sources: floating-rate loans to middle-market businesses, and equity stakes in collateralized loan obligations (CLOs). CLOs are pools of leveraged loans where the equity tranche absorbs losses first in exchange for higher potential returns. In Q4 2025, debt investments generated $5.3 million and CLO equity generated $4.3 million, making the two segments roughly equal contributors.
The CLO equity side is where the story gets complicated, as the effective yield on that sleeve compressed from 9.7% in Q3 to 8.6% in Q4, reflecting broader stress in the leveraged loan market. The fund recorded $18.3 million in combined unrealized and realized losses in Q4 alone, more than double the $7.5 million loss from the prior quarter. Management attributed the markdown primarily to the CLO equity book, describing the losses as “mainly a markdown of the CLO equity portion of the book” and “principally unrealized.”
The software sector has been a notable pressure point, with management flagging rising distress in the underlying loan market as a key driver of CLO equity markdowns.
The Distribution Is Not Covered by Earnings
Oxford distributed $0.105 per share in Q4 2025 while generating only $0.07 per share in net investment income (NII), resulting in a payout ratio of 150%. This gap was primarily funded by a return of capital, contributing to the fund’s 26% NAV erosion over the year. This represents a clear downward trend in earnings power, as NII per share has fallen steadily from $0.09 in Q1 to $0.07 in Q4, driven by lower benchmark rates and compressing yields in the fund’s CLO equity portfolio.
The balance sheet reflects the same pressure as total liabilities grew 16% year-over-year while shareholders’ equity contracted, a combination that signals rising leverage against a shrinking asset base. Making this worse, the leverage is locked in at a fixed cost, Oxford Square’s $72.1 million in 7.75% unsecured notes that do not adjust downward when rates fall, creating a structural mismatch as floating-rate asset income declines.
Meanwhile, the Fed’s 75-basis-point cuts since October 2025 have directly compressed income on the floating-rate loan side, squeezing the spread between what Oxford Square earns on assets and what it pays on debt.
Management’s Pivot and the Premium Problem
Oxford Square offers a 24% annualized yield, but this is driven by a collapsing share price rather than growth. NAV fell every quarter in 2025, dropping 26% from $2.30 to $1.69, as the fund recorded $18.3 million in Q4 losses, primarily from markdowns in its volatile CLO equity book.
The fund is trapped in a margin squeeze: it is locked into $74.8 million of 7.75% fixed-rate notes, while its floating-rate income has been slashed by 75 basis points of Fed cuts since late 2025. With Q4 earnings ($0.07/share) covering only 67% of the dividend ($0.105/share), OXSQ is liquidating its own capital to maintain payouts, leading management to announce a 67% dividend cut for mid-2026.
Verdict
The dividend is on thin ice, and since NII only covers about two-thirds of what Oxford Square pays out, they’re forced to dip into capital to fill the gap, a move that just isn’t sustainable if NAV keeps sliding. Last year’s -19% total return is a textbook yield trap: you’re pocketing a massive yield while your actual investment value evaporates. While shifting into first-lien loans is a smart stabilizing move, and the Fed’s recent pause at 3.75% offers some relief, the risks remain high. Until CLO markdowns level off and earnings actually cover the check, that massive payout ratio is the only metric that really matters for anyone chasing this yield.
Data Sources
- Oxford Square Capital Q4 FY2025 earnings call transcript and 8-K filing (March 3, 2026), providing NAV, NII, loss data, and management commentary
- Oxford Square Capital Q4 Earnings Call Highlights (user-provided document), providing direct management quotes and portfolio strategy context
- Federal Reserve Economic Data (FRED) via Fuse API, providing current Fed Funds Rate and rate cut timeline
- Alpha Vantage balance sheet data, providing year-over-year liability, equity, and debt structure comparisons