
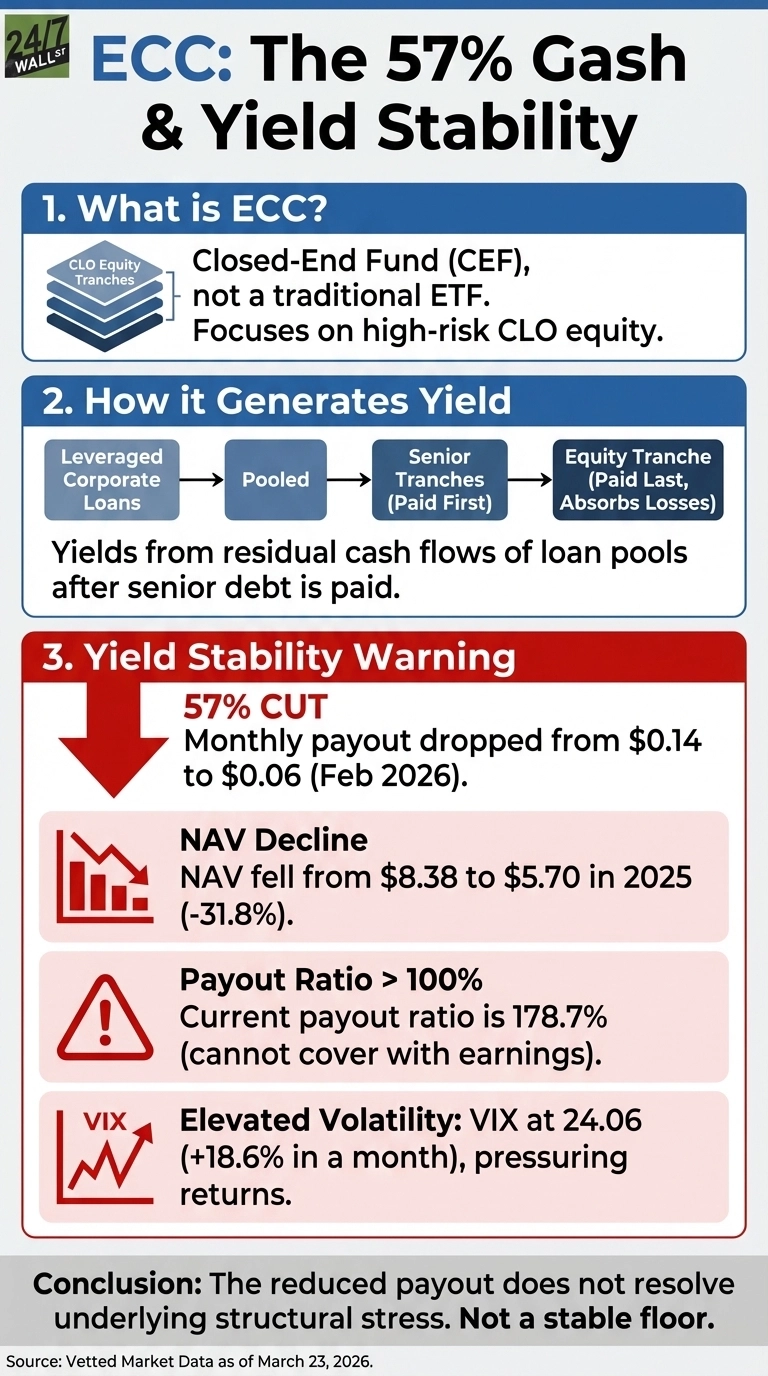
Launched in 2014, Eagle Point Credit’s (NYSE:ECC) monthly payout dropped from $0.14 to $0.06 in February 2026, a 57% cut that left income-focused holders with far less monthly cash flow. The share price has already fallen 36% year-to-date, meaning the income hit arrived on top of a 30.87% loss in share price. At a 178.7% payout ratio, even after the cut, the structural forces that caused the reduction have not reversed.
What ECC Actually Owns
Eagle Point Credit is a closed-end fund built around a single, high-risk asset class: the equity tranches of collateralized loan obligations. A CLO pools hundreds of leveraged corporate loans, slices the resulting cash flows into layers, and senior tranches are paid first and carry investment-grade ratings. The equity tranche sits at the bottom, collecting whatever cash remains after every other layer is paid, and absorbing losses first when borrowers default.
Rating agencies assign no credit rating to CLO equity. As explained in prior coverage of ECC’s CLO structure, this is structurally equivalent to owning the common equity of a highly leveraged company whose entire asset base consists of junk-rated corporate debt.
ECC adds its own leverage on top of that, as its portfolio leverage stood at 47.6% at year-end 2025. When CLO equity distributions slow due to rising defaults, ECC still owes interest on its borrowings, accelerating NAV erosion beyond what the underlying CLO stress alone would suggest.
Why the Cut Happened: The NAV Collapse
ECC’s NAV per common share fell to $5.70 by Q4 2025, down from $7.00 just one quarter earlier in Q3 2025. NAV began 2025 at $7.23, meaning it fell 21.1% across the full year.
The financial damage was severe as the fund reported a GAAP net loss of $109.9 million attributable to common stock in Q4 2025, and a negative 14.6% GAAP return on common equity for the year.
Management framed the cut as deliberate alignment: the company stated the “revised rate aligns with near-term earnings potential and aids capital retention for future investments.” In practice, paying $0.14 monthly required distributing capital the fund no longer had as income. Even at the new $0.06 rate, the payout ratio exceeds 100%, meaning ECC is still distributing more than it earns.
Why the Current Payout May Not Hold
The macro environment offers limited comfort as the VIX spiked to 29.49 on March 6, 2026, and sits at 24.59 as of March 23, up 17% over the past month. Elevated volatility directly pressures CLO equity returns by widening credit spreads and increasing default expectations across leveraged loan portfolios.
The 10-year minus 2-year Treasury spread has compressed to 0.51%, sitting in the 21st percentile of its 12-month range. A flattening curve squeezes the income differential on which CLO equity depends, adding another layer of pressure on ECC’s distributions.
ECC’s distribution history shows this pattern is not new. The fund paid $0.20 per month in 2018 and 2019, then dropped to $0.08 per month throughout 2020 amid pandemic credit stress. It recovered and settled at $0.14 for most of 2023 through 2025, then came this cut. The pattern suggests $0.06 is tied to current credit conditions rather than a permanent floor, and those conditions remain under pressure.
As of March 23, 2026, analyst sentiment for Eagle Point Credit Company (ECC) is shifting rapidly following a 57% distribution cut. While aggregate data like Yahoo Finance displays a “stale” average price target of $8.69 (skewed by a legacy $20.00 high), more recent March updates reflect a much harsher reality. B. Riley Securities slashed its target to $4.25 on March 16, and Ladenburg Thalmann downgraded the stock to Neutral on March 2. With shares trading at $3.61, the market remains skeptical that the $5.70 NAV will stabilize in the near term.
Total Return Is the Harder Story
The yield at current prices looks large on paper, but it masks a “yield trap” reality. ECC shares have plummeted 53.7% over the past year and 68.5% over the past five years. Even after factoring in all distributions, a five-year holder would still be down 13.8% on their total investment.
In response, ECC authorized a $100 million common stock repurchase program alongside the 57% distribution cut announced on February 17, 2026. Furthermore, management is actively pivoting the portfolio, with 26% now allocated to non-CLO credit assets. These moves collectively signal that the core CLO equity strategy is failing to generate adequate returns in the current credit cycle.
Why the Reduced Payout Does Not Resolve the Underlying Stress
The data does not support treating $0.06 as a confirmed floor. Even at the reduced rate, the payout ratio exceeds 100%, meaning ECC is still distributing more than it earns. NAV has declined sharply, market volatility remains elevated, and the yield curve spread continues to compress. The cut was necessary, but the conditions that caused it have not reversed.
ECC fits investors who understand CLO equity mechanics, accept that distributions fluctuate with credit cycles, and are investing with a multi-year horizon on the thesis that credit conditions normalize and NAV recovers. For investors who need a stable monthly income, the structural mismatch between what ECC owns and what stable income requires is the core problem. The $0.06 payout reflects that mismatch rather than resolving it.
Data Sources
- High Yielding ECC’s CLOs Are Unrated For A Risky Reason: Used for NAV trajectory ($8.38 to $5.70), leverage ratio (47.6%), structural description of CLO equity tranches, and five-year total return context.
- Eagle Point Credit Q4 2025 Earnings Release (February 17, 2026): Used for NAV per share ($5.70), GAAP net loss ($109.9 million), distribution cut announcement and management rationale, and share repurchase program details.
- Federal Reserve Economic Data (FRED) — VIX: Used for current volatility environment context, including March 2026 spike to 29.49 and month-over-month change.
- Federal Reserve Economic Data (FRED) — Yield Curve Spread: Used for yield curve compression data and percentile rank context for CLO equity sustainability analysis.