State Street’s 2026 Global ETF Outlook calls for $2.1 trillion of US ETF inflows this year, with the lion’s share flowing into three core funds: Vanguard S&P 500 ETF (NYSEARCA:VOO | VOO Price Prediction), iShares Core S&P 500 ETF (NYSEARCA:IVV), and Vanguard Total Stock Market ETF (NYSEARCA:VTI). Each charges 3 basis points, each defaults into model portfolios, and each is up roughly 6% year to date. With nearly 70% of advisors now using model portfolios built on ETFs, VOO, IVV, and VTI are the rails that mechanical 401(k) and rebalancing flows ride into the market.
Why these three are catching the flows
VOO holds $839 billion in net assets and has compounded to a 28% one-year return and 313% over ten years. IVV mirrors it almost exactly, posting a 28% one-year return on the same S&P 500 basket. VTI, which tracks the CRSP US Total Market Index and includes mid- and small-caps, is up 27% over the past year and 237% over ten. The performance gap between the S&P 500 pair and the total-market fund is the entire investor decision.
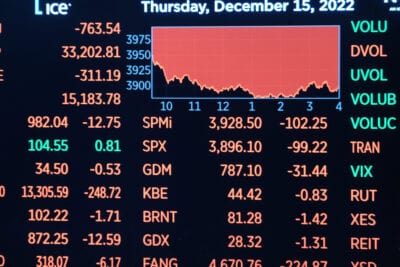
Recent action shows why mechanical flows matter. After a March volatility spike sent the VIX to 31 on March 27, the gauge settled near 17, and all three ETFs rebounded roughly 9% in a single month. Calm conditions and steady payroll contributions underpin State Street’s $2.1 trillion call.
The macro factor: the Fed’s next move
The single variable most likely to swing 2026 returns is the Fed’s rate path. The upper bound sits near 3.8% after 75 basis points of cuts from the September 2025 peak around 4.5%. The 10-year Treasury is near 4.4%, in the 82nd percentile of the past year despite the easing.
Watch the CME FedWatch tool weekly and the Fed dot plot at each FOMC meeting. The threshold that matters: if the 10-year crosses 4.6% on sticky inflation, the discount rate applied to the S&P 500’s mega-cap growth names rises, and VOO and IVV feel it more than VTI because their top holdings skew more heavily to long-duration tech cash flows. A surprise hold or hike would compress multiples across all three. A clean cut to 3.5% before Q3 does the opposite.
The fund-specific factor: concentration vs. breadth
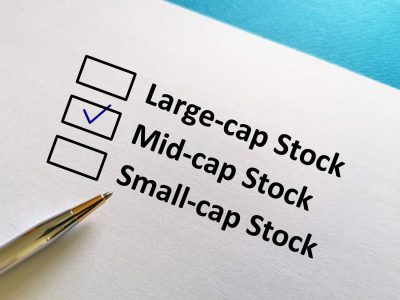
VOO and IVV are the same product wearing different sponsor logos, both pinned to the S&P 500’s market-cap weighting. That weighting now leans hard on a handful of trillion-dollar names, which is why their one-year returns edged VTI’s by roughly 130 basis points. VTI’s total-market design dilutes that mega-cap tilt with thousands of smaller companies. When leadership broadens, VTI catches up. When the top ten carry the index, VOO and IVV pull ahead.
Monitor the equal-weight S&P 500’s relative performance against the cap-weighted index, published daily by S&P Dow Jones Indices. A sustained reversal favoring equal-weight lasting more than a quarter signals that VTI’s structure is about to outperform.
How to slot them by account type
- Taxable brokerage: VTI spits off slightly fewer capital gains distributions than most funds, and Vanguard’s heartbeat-trade mechanism applies to both VTI and VOO. Either is tax-efficient. IVV is fine, but doubling up with VOO creates wash-sale headaches when harvesting losses.
- IRA or 401(k): Tax drag is irrelevant inside a wrapper. VTI for full-market exposure including small caps. VOO or IVV if you want pure large-cap and plan to bolt on a separate small-cap sleeve later.
- Active trading account: IVV typically shows the tightest intraday spreads of the three and trades like a major index future. VOO and VTI are deep but built more for buy-and-hold accumulation.
What to watch from here
The macro signal is the June and September FOMC meetings: a cut to 3.5% lifts all three, a hold near 3.8% on inflation data caps the upside. The fund-specific signal is the equal-weight versus cap-weight spread. If breadth widens through summer, VTI quietly does its job. If the mega-caps keep leading, VOO and IVV stay the cleanest expressions of the State Street flow story.