
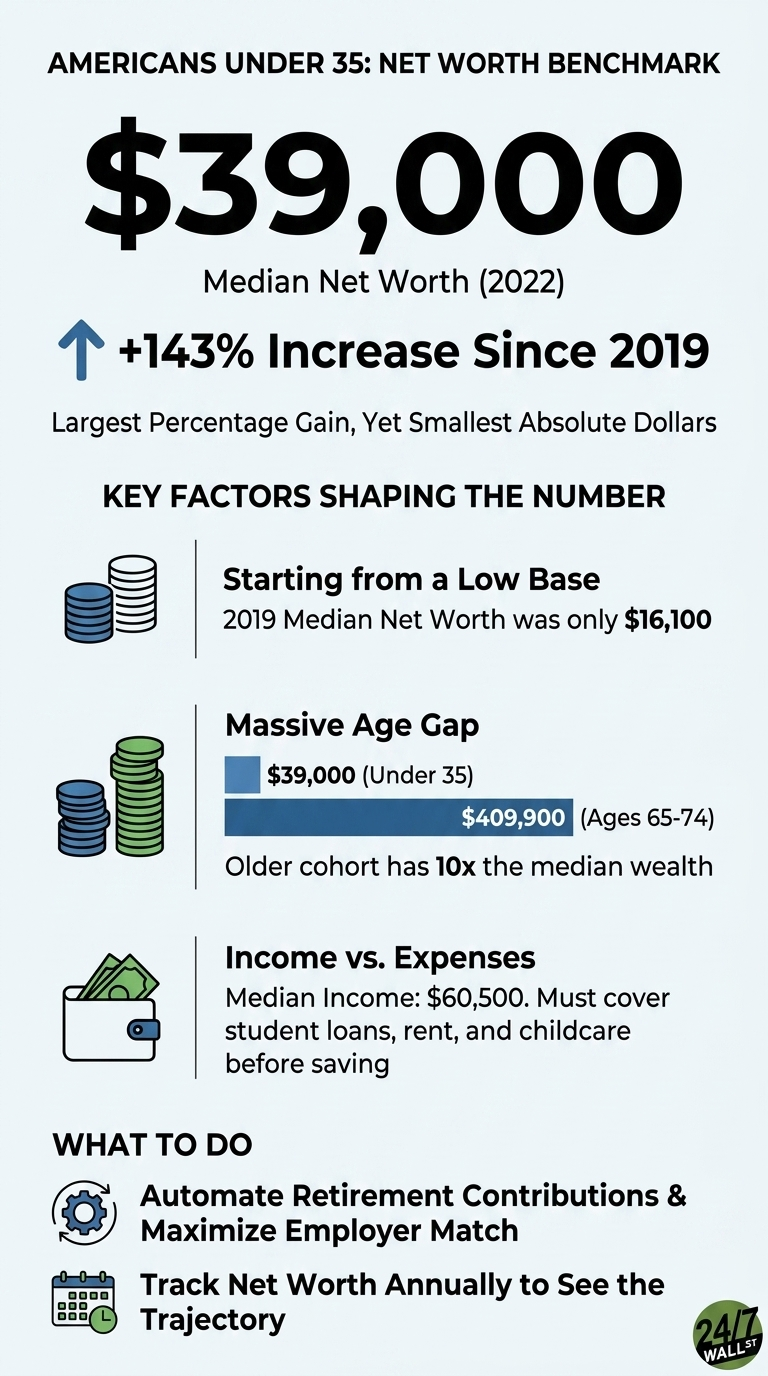
The Federal Reserve’s 2022 Survey of Consumer Finances reported that families headed by someone under 35 saw their median net worth more than double in three years, jumping from $16,100 in 2019 to $39,000 in 2022. That 143% increase was the largest percentage gain of any age group. The dollar figures behind the percentage gain remain small in absolute terms.
Even after doubling, families under 35 sit at the bottom of the age distribution by a wide margin. Families headed by someone aged 65 to 74 had a median net worth of $409,900 in 2022, more than 10 times that of the youngest cohort. The percentage gain reflects how much younger families started with, rather than a narrowing of the generational wealth gap.
Average vs. median, and why it matters here
The median is the middle household: half above, half below. The average gets distorted by a small number of very wealthy families. If ten people each have $5,000 in savings and an eleventh walks in with $5 million, the median stays at $5,000 while the average jumps to roughly $459,000. For a cohort like under-35 families, where a handful of high earners in tech or finance can pull the average up sharply, the median is the better proxy for a typical household. That median is $39,000.
The age ladder in SCF 2022
The 2022 SCF data shows median net worth climbing steadily with age before tapering in retirement. The under-35 figure is the floor of that ladder.
- Under 35: $39,000
- 35 to 44: $135,600
- 45 to 54: $247,200
- 55 to 64: $364,500
- 65 to 74: $409,900
The gap between the youngest and oldest brackets is roughly $370,000 at the median. A 143% gain on a $16,100 base adds about $23,000 in absolute terms, while a 10% gain on the 65-to-74 base would add roughly $41,000. The reality is that percentage growth and dollar growth refer to different things, and for wealth accumulation, dollars are what compound, and this is the big takeaway.
Why does the percentage gain look so dramatic?
The 37% overall surge in median net worth between 2019 and 2022 was the largest three-year increase in the history of the modern SCF, more than double the next-largest increase on record. The Fed attributed the move primarily to rising house and corporate equity prices that outpaced inflation, with housing wealth doing the heavy lifting for middle-income families.
For under-35 households, the same forces applied to a much smaller base. A first-time buyer who closed on a home in 2019 or 2020 captured several years of price appreciation. A young saver with a small 401(k) balance benefited from the run in equities. Both translate into large percentage gains because the starting balances were small. The mechanism that produced the 143% number is the same mechanism that produced the low baseline: younger families own fewer assets, and what they do own is concentrated in a primary residence and retirement accounts that are still early in the contribution curve.
Income tells the same story
The income side reinforces the gap as families under 35 had a median income of $60,500 in 2022. That is the engine for future net worth, but it has to cover student loans, rent or a starter mortgage, and child care before any of it reaches a brokerage account or home equity. Older families benefit from decades of compounding on wages earned earlier in their careers, plus paid-down mortgages and vested retirement accounts.
Reading the data for under-35 households
Two observations from the 2022 SCF for the under-35 cohort:
- Early balances move primarily in percentage terms, with dollar gains staying small. Automated retirement contributions and an employer 401(k) match build the base on which future percentage gains compound.
- The age-bracket ladder serves as a reference point, and the jump from $39,000 under 35 to $135,600 in the 35-to-44 bracket implies most of that gain comes from sustained saving and home equity build-up over a single decade. Annual net worth tracking, rather than tracking only when markets move, surfaces the trajectory earlier in the cycle.
The 143% headline is real, and it might not even come as a surprise. It is also a function of how little the cohort started with, and closing the gap with older age groups will require dollar growth in addition to percentage growth.