
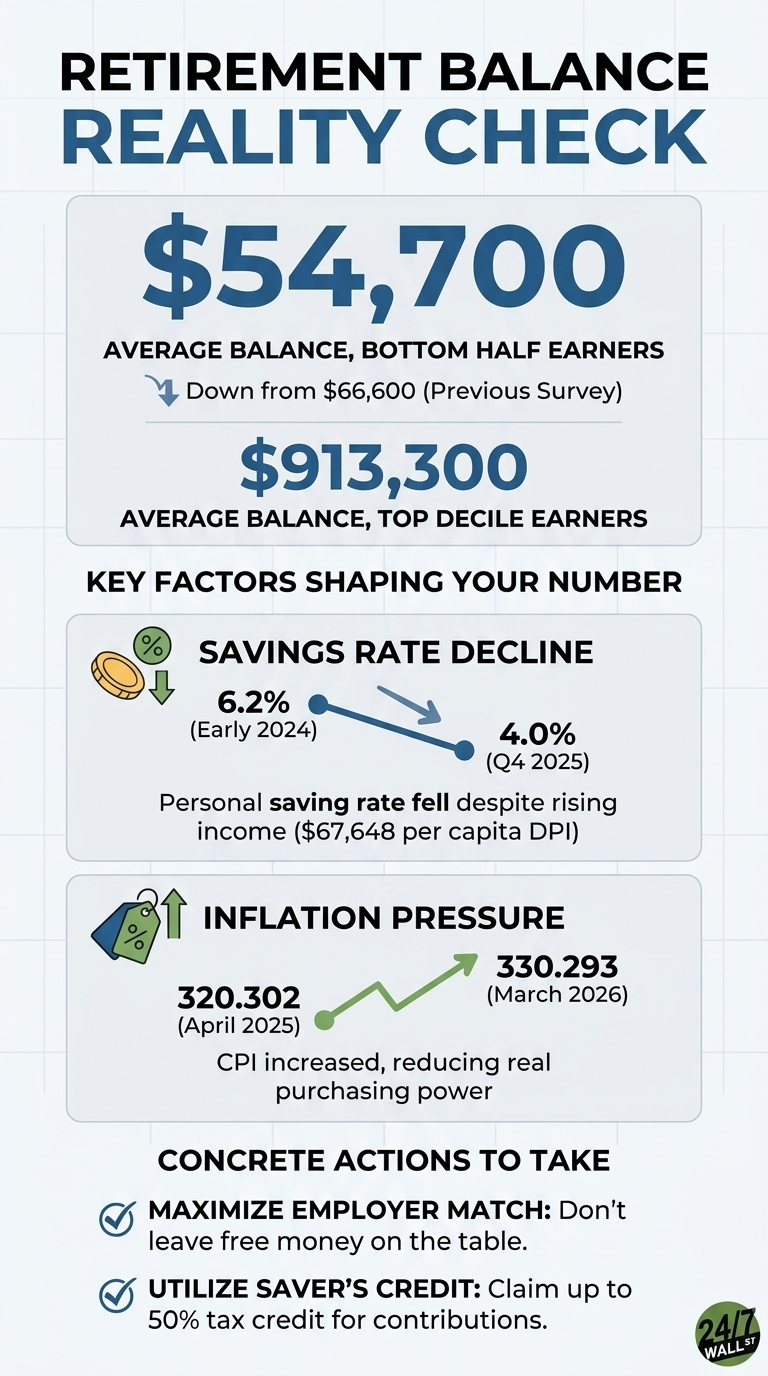
The Federal Reserve’s 2022 Survey of Consumer Finances reported that retirement plan participation hit its highest level since 2010. The same survey reported that mean balances for participants in the bottom half of the income distribution fell from $66,600 to $54,700, while top-decile participants reached $913,300. Participation is a headcount. Balances are the dollars that actually fund retirement. The two numbers are moving in opposite directions for the households that need the system to work hardest for them.
The mean is the relevant figure here because it is the one that fell. Means are normally pulled up by outliers. When the mean for half the population declines, the typical participant in that group is losing ground. A simple illustration: if ten savers each hold $5,000 and one walks in with $5 million, the median stays at $5,000 while the mean jumps to roughly $459,000. The mean responds to the people at the top. For bottom-half participants to see their mean drop from $66,600 to $54,700, the broad base of the distribution had to deteriorate at the same time the top of that bottom half failed to offset it.
The contrast at the top of the income ladder reframes what participation actually measures. Top-decile participants had mean balances of $913,300, roughly 17 times the bottom-half figure. Both groups are counted as participants. Both contribute to the headline rate that hit a post-2010 high. Only one group is accumulating retirement security at a level sufficient to fund a multi-decade retirement. A 4% withdrawal from $913,300 yields about $36,532 per year. The same $54,700 withdrawal yields about $2,188 per year, or roughly $182 per month.
Participation rates rise when employers add automatic enrollment, when default contribution rates kick in, and when more workers technically have an account opened in their name. None of those mechanics guarantees that the dollars going in are large enough to compound into a retirement. A worker who is auto-enrolled at 3% of a $40,000 salary contributes $1,200 a year before any match. The same default at a $200,000 salary contributes $6,000. The concern is that the participation column treats both workers identically, while the balance column does not.
The SCF data itself offers a clearer explanation, as the bottom-half of participants saw their mean balances fall from $66,600 to $54,700 during a period when overall participation was rising, median family income for the bottom quintile grew only 5% to $21,600, and the fraction of families that saved at all edged down from 59% to 56% between 2019 and 2022. Families at the lower end of the income distribution were being added to the participant headcount even as their capacity to contribute meaningfully was constrained by income levels that left little room for anything beyond essential expenses. The balance column reflects that constraint directly.
The takeaway from the 2022 SCF is that participation is a necessary but insufficient measure. A worker can be enrolled, contributing, and still on track to retire on a balance that funds a few hundred dollars a month. The gap between $54,700 and $913,300 measures how much the system is doing for participants once they are in it, rather than who is counted in it.
Why the $54,700 Figure Is the One Worth Watching
Three mechanical levers most directly influence bottom-half balances.
- Deferral rates above the auto-enrollment default. Most automatic enrollment defaults sit at 3% to 4%. A bottom-half participant contributing the default on a modest salary will not, mathematically, close the gap to a livable balance at that pace. Each additional percentage point of deferral, compounded over a working career, has an outsized effect on the $54,700 starting point compared with other variables.
- The employer match relative to other cash uses. An unmatched dollar inside a 401(k) is worth one dollar. A matched dollar is worth two. Contributions that stop below the match cap leave behind compensation that the top decile collects in full, which is one mechanical reason the two groups separate over time.
- Coverage outside the workplace. The SCF data covers participants. Households not counted at all are in worse shape. A Roth or traditional IRA provides the same tax-advantaged structure outside the workplace and is the channel through which non-participants enter the system, as measured by the survey.
Ultimately, participation rates are likely to continue to rise as auto-enrollment spreads. Whether the bottom-half balance figure rises with them is the critical number to watch in the next survey.