Retirees need predictable income and protection from large drawdowns during withdrawal years. Factor rotation strategies promise outperformance by shifting between value, growth, momentum, and quality exposures as market conditions change. But can an actively managed fund that chases performance cycles deliver the stability retirees require?
A Growth Engine, Not an Income Machine
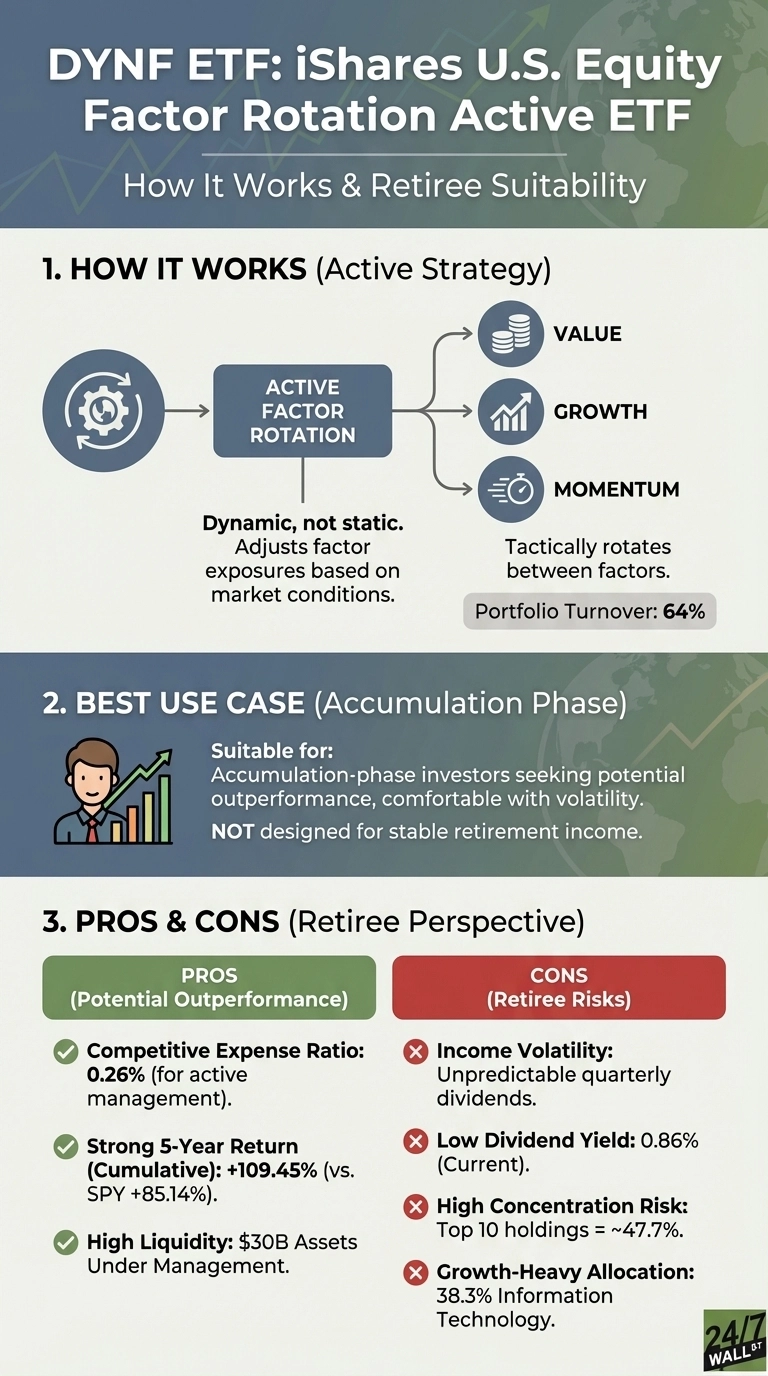
iShares U.S. Equity Factor Rotation Active ETF (NYSEARCA:DYNF | DYNF Price Prediction) seeks to outperform large and mid-cap U.S. equity markets by dynamically allocating across equity factors based on BlackRock’s quantitative models.
With $30 billion in assets and a 0.26% expense ratio, DYNF delivered a cumulative 109% return over five years, outpacing the S&P 500’s 85% gain. That translates to roughly 22% annualized returns versus 17% for passive indexing.
But the portfolio composition reveals a growth-heavy tilt that contradicts traditional retirement investing principles. Information technology comprises 38% of holdings, with NVIDIA (NASDAQ:NVDA), Apple (NASDAQ:AAPL), and Microsoft (NASDAQ:MSFT) representing 23% combined. The fund allocates just 2.3% to utilities and 2.5% to consumer staples, the defensive sectors retirees typically rely on during market turbulence.
Income Volatility Creates Planning Problems
DYNF’s dividend profile exposes a critical weakness for retirees. Quarterly payouts fluctuate dramatically. In 2025, distributions ranged from $0.12 to $0.18 per share, creating a 50% variance. Year-over-year totals show similar inconsistency, with 2025 distributions jumping 83% from 2024 levels, while 2024 fell 24% from 2023.
The current 0.86% yield falls far short of the 3% to 4% income targets most retirees need. A $500,000 DYNF position would generate roughly $4,300 annually, compared to $19,000 from a traditional dividend-focused portfolio yielding 3.8%.
The Tradeoffs Are Substantial
Active factor rotation introduces sequence-of-returns risk that can devastate retirement portfolios. If DYNF rotates into momentum stocks before a market correction, retirees forced to withdraw during the downturn lock in permanent losses. The fund’s 64% annual turnover creates tax inefficiency in taxable accounts, reducing after-tax returns.
Concentration risk compounds these concerns. The top 10 holdings represent 48% of the portfolio, meaning poor performance from a handful of mega-cap tech stocks can significantly impact returns. NVIDIA alone, with its 2.28 beta, contributes more than twice the market’s volatility.
DYNF’s Profile and Typical Use Cases
Factor rotation strategies like DYNF typically attract accumulation-phase investors comfortable with volatility, while retirees drawing income often prefer dividend-focused funds with predictable distributions. The unpredictable distribution schedule makes budgeting difficult for those relying on regular income, and the low yield means investors must sell shares to meet living expenses. Early retirees in the critical first decade of withdrawal face exposure to the fund’s growth-heavy allocation and factor timing risks.
The fund’s 38% technology weighting and minimal defensive positioning historically align with growth-oriented portfolios rather than capital preservation strategies.
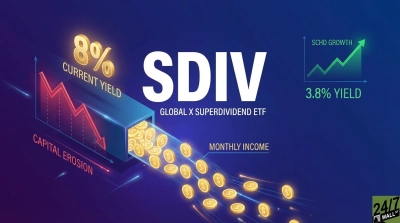
SCHD Offers Different Characteristics
Schwab U.S. Dividend Equity ETF (NYSEARCA:SCHD) offers a different approach. The fund delivers a 3.8% yield with consistent quarterly distributions, providing four times DYNF’s income generation. SCHD’s 0.06% expense ratio undercuts DYNF by 77%, preserving more capital over multi-decade retirement horizons.
SCHD screens for dividend quality and growth rather than chasing factor momentum, resulting in a more stable portfolio focused on mature, profitable companies with sustainable payout ratios. SCHD’s 3.8% yield and consistent quarterly distributions contrast with DYNF’s 0.86% yield and variable payout schedule, representing different approaches to equity investing—one prioritizing predictable cash flow, the other pursuing potential outperformance through factor rotation.
DYNF’s growth tilt, income inconsistency, and concentration risks reflect its design as a factor rotation vehicle rather than an income-generating investment.