Emerging markets dividend stocks rarely grab headlines, but investors focused on income generation in 2026 should pay attention. The SPDR S&P Emerging Markets Dividend ETF (NYSEARCA:EDIV) combines a 4.5% yield with exposure to a segment of global markets that many forecasters view favorably this year.
Built for Income Investors Seeking Global Diversification
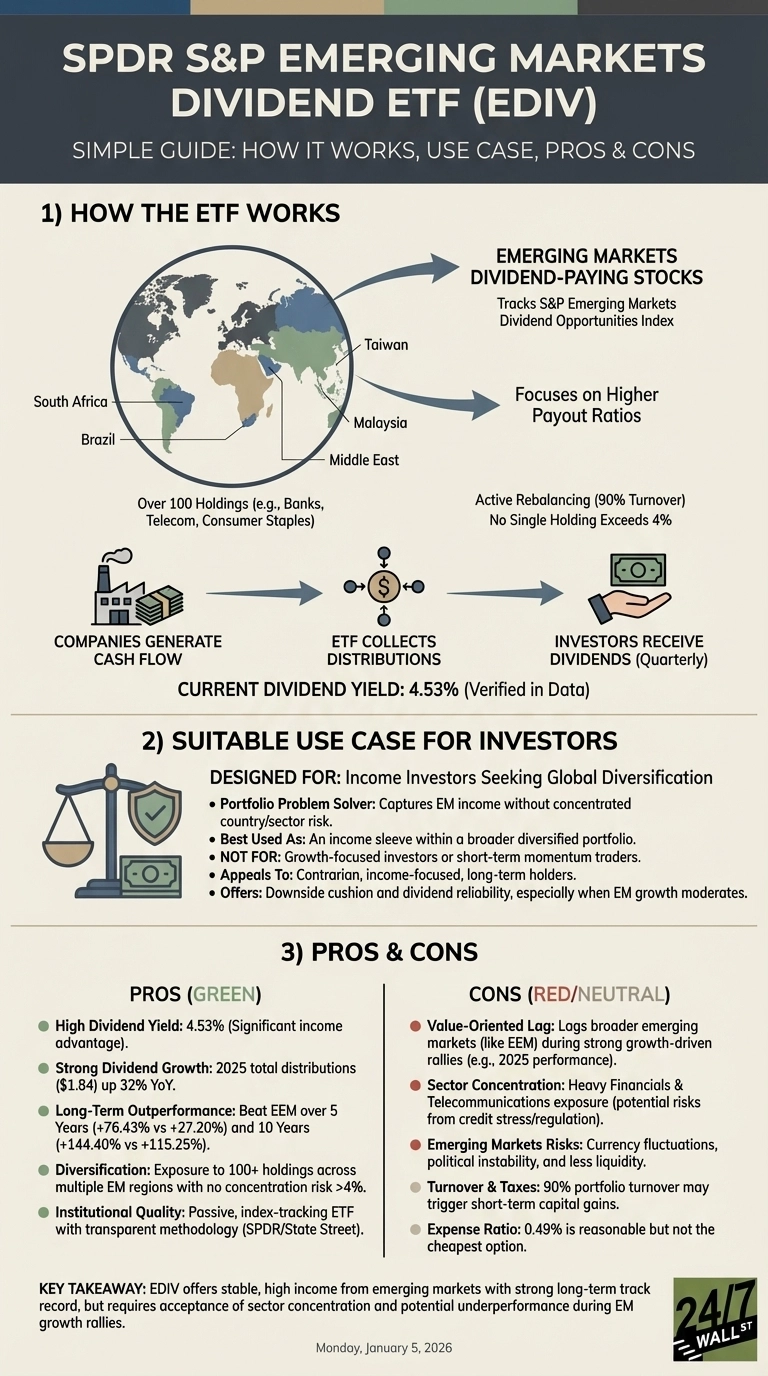
EDIV solves a specific portfolio problem: capturing dividend income from emerging markets without concentrated country or sector risk. The fund tracks the S&P Emerging Markets Dividend Opportunities Index, holding over 100 stocks across South Africa, Brazil, Taiwan, Malaysia, and the Middle East. No single holding exceeds 4% of assets.
The return engine is straightforward. Companies generate cash and distribute it as dividends. The fund’s 4.5% yield comes primarily from financials and telecommunications firms in developing economies where dividend payout ratios tend to be higher than in U.S. growth stocks. In 2025, EDIV distributed $1.84 per share to investors, up 32% from the prior year.
Long-Term Track Record Beats Broader Emerging Markets
Over the past decade, EDIV delivered 144% total returns, outperforming the iShares MSCI Emerging Markets ETF (NYSEARCA:EEM | EEM Price Prediction) by 29 percentage points. The five-year comparison is even more striking, with EDIV up 76% versus EEM’s 27%.
However, 2025 showed a reversal. EEM surged 39% while EDIV gained 17%. This gap reflects EDIV’s value-oriented approach. When emerging markets rally on growth expectations, dividend-focused strategies tend to lag. The question for 2026 is whether income stability or price appreciation will matter more to investors.
The Tradeoffs: Volatility, Concentration, and Tax Complexity
EDIV’s 0.49% expense ratio is reasonable but not cheap. The fund carries emerging markets risks: currency fluctuations, political instability, and less liquid trading in underlying stocks. The 90% portfolio turnover rate means frequent rebalancing, which can trigger short-term capital gains.
Sector concentration is another consideration. Financials dominate the top holdings, with banks from South Africa, Brazil, and Malaysia representing a significant portion of assets. If emerging markets banking sectors face credit stress or regulatory pressure, EDIV’s income stream could compress quickly.
Not for Growth-Focused or Short-Term Traders
EDIV is not appropriate for investors prioritizing capital appreciation over income. Those seeking exposure to emerging markets technology or consumer growth stories will find better fits elsewhere. Similarly, traders looking for momentum plays should avoid this fund. The dividend focus means EDIV will underperform during sharp emerging markets rallies driven by growth sectors.
Consider EEM for Broader Exposure
For investors wanting emerging markets exposure without the dividend filter, EEM offers a compelling alternative. With $20.6 billion in assets versus EDIV’s $931 million, EEM provides significantly better liquidity. The expense ratio is lower at 0.72%, and the fund holds major technology and consumer names like Tencent and Samsung that EDIV largely excludes. The tradeoff is yield: EEM pays just 1.4% compared to EDIV’s 4.5%. EDIV works best as an income sleeve within a diversified portfolio, offering exposure to emerging markets cash flows with above-average yield, but investors must accept sector concentration and the likelihood of lagging during growth-driven rallies.