Can Retirees Count on QYLD’s Amazing 11% Dividend Any More?

Photo of Michael Williams
By Michael Williams Published

Quick Read

  • QYLD’s annual distributions have dropped 24% from $2.67 per share in 2021 to roughly $2.04 in 2025.

  • QYLD returned 44% over five years while QQQ delivered 100%. The covered call strategy sacrificed over half the market’s gains.

  • JEPQ uses active management to adjust option coverage instead of selling calls on 100% of holdings. It yields 9% with better total returns.

This post may contain links from our sponsors and affiliates, and Flywheel Publishing may receive compensation for actions taken through them.
Can Retirees Count on QYLD’s Amazing 11% Dividend Any More?

© Inside Creative House / Shutterstock.com

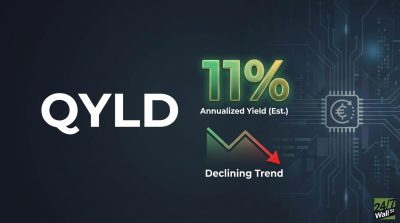
The Global X NASDAQ 100 Covered Call ETF (NYSEARCA:QYLD) has attracted income-seeking investors with its impressive 11% yield, but recent trends suggest retirees should approach this fund with caution. The sustainability of this income stream faces meaningful headwinds.

How QYLD Generates Its High Yield

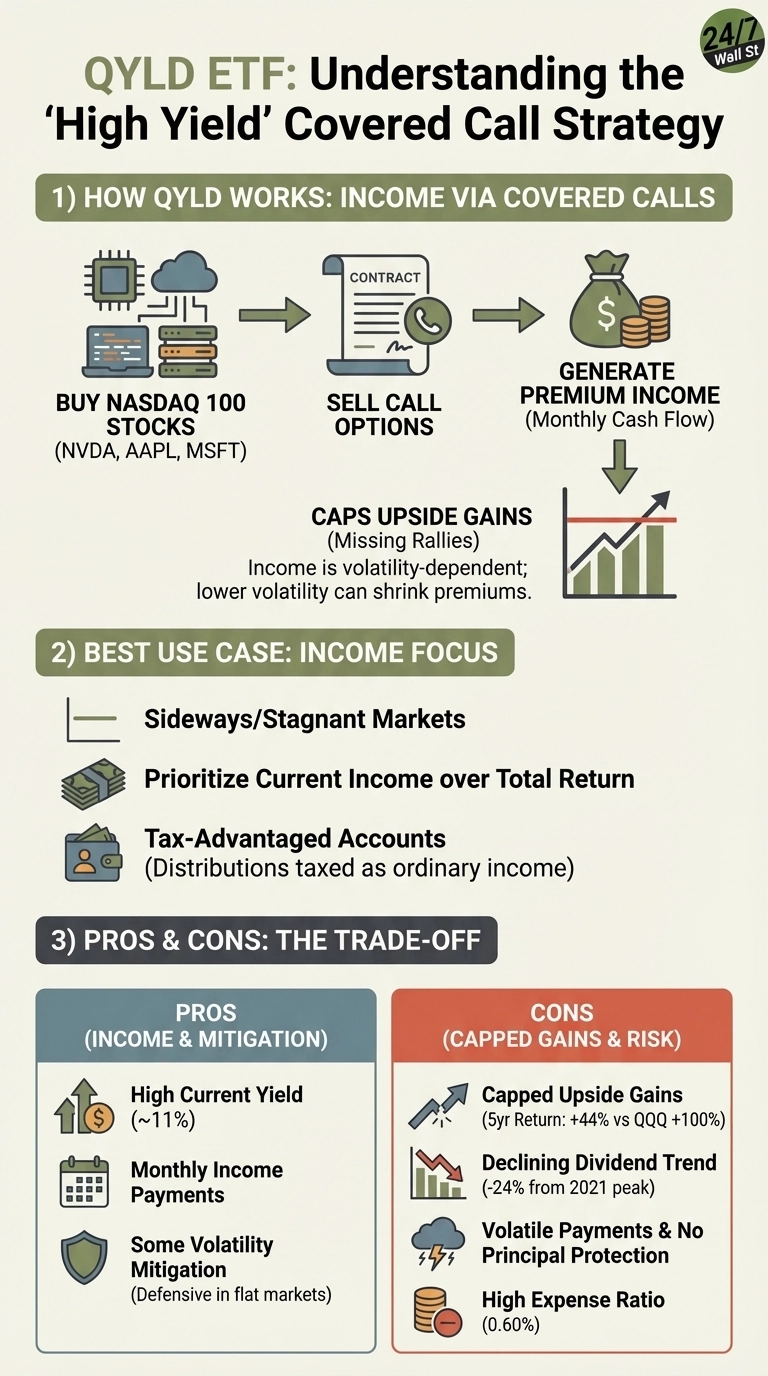
QYLD produces income through a covered call strategy on the NASDAQ 100 index. The fund holds the same tech-heavy stocks as the index—with top positions including NVIDIA (NASDAQ:NVDA | NVDA Price Prediction) (9.2%), Apple (NASDAQ:AAPL) (8.1%), and Microsoft (NASDAQ:MSFT) (7.3%)—but simultaneously sells call options on these holdings. When investors buy these call options, they pay premiums that become the fund’s primary income source. This generates consistent monthly cash flow but caps upside potential when markets rally.

The Declining Dividend Reality

QYLD’s distribution history reveals a troubling pattern. Annual payouts have declined 24% from their 2021 peak of $2.67 per share to approximately $2.04 in 2025. Monthly payments now fluctuate between $0.16 and $0.19, reflecting the volatility-dependent nature of option premium income. When market volatility drops—as it has during recent periods of steady gains—the premiums QYLD can collect shrink accordingly.


The mechanics are straightforward: covered call funds cannot grow dividends like traditional dividend stocks. They can only redistribute the option income they collect, which varies with market conditions. In low-volatility bull markets, QYLD’s income generation weakens.

An infographic titled 'QYLD ETF: Understanding the 'High Yield' Covered Call Strategy' with a 24/7 Wall St logo. It is divided into three sections. Section 1, 'HOW QYLD WORKS: INCOME VIA COVERED CALLS', shows a flow diagram: 'Buy NASDAQ 100 Stocks (NVDA, AAPL, MSFT)' represented by a circuit board and servers, leads to 'Sell Call Options' shown as a contract with a phone, which leads to 'Generate Premium Income (Monthly Cash Flow)' depicted by a money bag and coins. Below this, a stock chart with a red cap illustrates 'Caps Upside Gains (Missing Rallies)', with text explaining that income is volatility-dependent and lower volatility can shrink premiums. Section 2, 'BEST USE CASE: INCOME FOCUS', lists three points with icons: 'Sideways/Stagnant Markets' (horizontal line), 'Prioritize Current Income over Total Return' (stacked money bills), and 'Tax-Advantaged Accounts (Distributions taxed as ordinary income)' (wallet with person). Section 3, 'PROS & CONS: THE TRADE-OFF', is split into two columns. The left, light blue column, 'PROS (INCOME & MITIGATION)', lists 'High Current Yield (~11%)', 'Monthly Income Payments', and 'Some Volatility Mitigation (Defensive in flat markets)', each with an icon. The right, red column, 'CONS (CAPPED GAINS & RISK)', lists 'Capped Upside Gains (5yr Return: +44% vs QQQ +100%)', 'Declining Dividend Trend (-24% from 2021 peak)', 'Volatile Payments & No Principal Protection', and 'High Expense Ratio (0.60%)', each also with an icon.
24/7 Wall St.
This infographic details how the QYLD ETF’s covered call strategy generates income, outlining its use cases, benefits, and inherent risks for investors.

The Total Return Trade-Off

More concerning for retirees is QYLD’s massive underperformance relative to simply holding the NASDAQ 100. Over the past five years, QYLD returned 44% while the Invesco QQQ Trust (NASDAQ:QQQ) delivered 100%—a 56 percentage point gap. Even accounting for QYLD’s distributions, investors sacrificed more than half the market’s gains. The 10-year comparison is starker: QYLD’s 131% total return versus QQQ’s 447%.


As Seeking Alpha analyst The Alpha Analyst noted in October 2025, “GPIQ’s active and flexible coverage is shown to outperform QYLD in various market conditions, offering better upside capture and reasonable downside protection.” Newer covered call strategies with dynamic approaches are now outpacing QYLD’s static methodology.

A More Flexible Alternative

The JPMorgan Nasdaq Equity Premium Income ETF (NASDAQ:JEPQ) employs an actively managed equity-linked notes strategy that provides similar income—currently yielding around 9%—while maintaining more flexibility to participate in market gains. The fund’s active approach allows managers to adjust option coverage based on market conditions rather than mechanically selling calls on 100% of holdings. With lower expenses and stronger total returns than QYLD, JEPQ represents an evolution in covered call strategies that addresses many of QYLD’s structural limitations. For income investors in 2026, JEPQ offers a more balanced approach to generating yield without completely sacrificing growth potential.

Photo of Michael Williams
About the Author Michael Williams →

I am a long time investor and student of business, and believe finding good companies that can become great investments is the best game on earth. After 20 years of writing and researching the public markets it is clear that individuals have never had more tools and information to take control of their financial lives. From ETFs and $0 commissions to cryptos and prediction markets there has never been a greater democratization of access to investing. 

I write to help people understand the investments available to them so they can make the best choice for their portfolio, whether they're starting out or looking for income in retirement. 

Featured Reads

Our top personal finance-related articles today. Your wallet will thank you later.

Continue Reading

Top Gaining Stocks

CBOE Vol: 1,568,143
PSKY Vol: 12,285,993
STX Vol: 7,378,346
ORCL Vol: 26,317,675
DDOG Vol: 6,247,779

Top Losing Stocks

LKQ
LKQ Vol: 4,367,433
CLX Vol: 13,260,523
SYK Vol: 4,519,455
MHK Vol: 1,859,865
AMGN Vol: 3,818,618