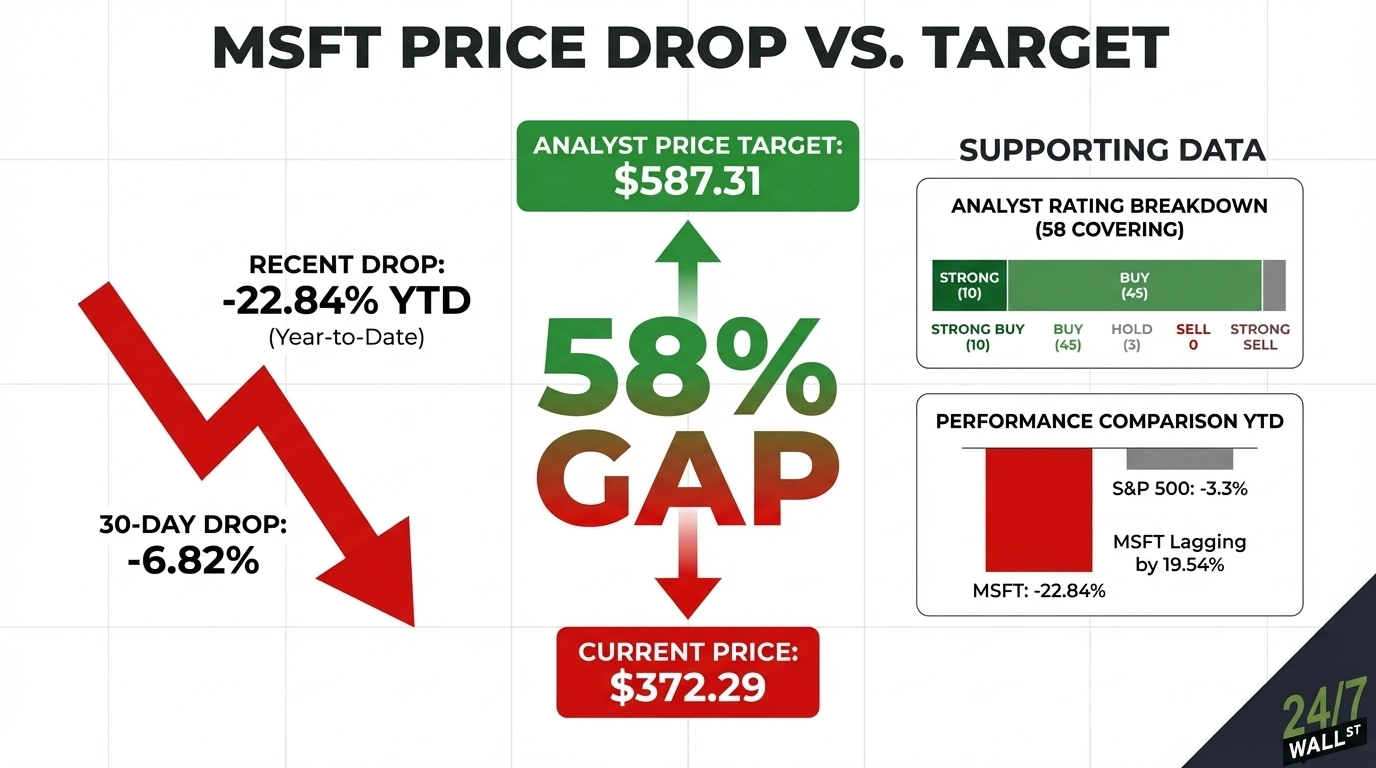
Microsoft (NASDAQ:MSFT | MSFT Price Prediction) currently trades at $372.29, while the average analyst price target sits at $587.31, a gap of roughly 58% between where the stock is and where Wall Street thinks it belongs.
Microsoft operates three core segments: Productivity and Business Processes (Microsoft 365, LinkedIn, Dynamics 365), Intelligent Cloud (Azure and enterprise services), and More Personal Computing (Windows, Xbox, Surface). CEO Satya Nadella has positioned Azure as the backbone of enterprise AI adoption, a narrative Wall Street rewarded generously until recently.
The Stock Has Sold Off Hard Despite Consistent Earnings Beats
When Microsoft reported Q2 FY2026 results on January 28th, the stock dropped 9.99% on the day despite beating EPS estimates by 7.57% and posting revenue of $81.27 billion against an $80.28 billion estimate.
The culprit behind this massive selloff was the company’s capital expenditure spending. CapEx nearly doubled year-over-year to $29.88 billion in Q2, a 89% increase, raising a legitimate question: is Azure growing fast enough to justify the bill? Azure’s growth rate has been decelerating, moving from 40% in Q1 FY2026 to 39% in Q2, with guidance pointing to 37% to 38% growth next quarter.
Microsoft is down 22.84% year-to-date from a high near $520 in August 2025, a slide driven by valuation compression across high-multiple tech names and specific concern about AI spending trajectory. The Q2 earnings reaction accelerated a decline already underway.
Analysts Are Holding Their Price Targets
Of the 58 analysts covering the stock, 10 rate Microsoft a Strong Buy, 45 rate it a Buy, and 3 rate it a Hold. There are zero Sell or Strong Sell ratings, which speaks to the widely held consensus that the company remains a high-quality, durable compounder despite near-term uncertainties.
The bull thesis rests on three pillars:
- Commercial remaining performance obligation surged 110% year-over-year to $625 billion in Q2.
- Microsoft Cloud crossed $51.50 billion in a single quarter for the first time, growing 26% year-over-year.
- The restructuring of the OpenAI partnership locked in an incremental $250 billion Azure services commitment from OpenAI and extended Microsoft’s IP rights through 2032.
Analysts frame the CapEx concern differently than the market. As CEO Satya Nadella put it, “We are still in the beginning phases of AI diffusion and its broad GDP impact, and already we’ve built an AI business that is larger than some of our biggest franchises that took decades to build.” If Azure’s growth reaccelerates in the back half of FY2026, the spending narrative shifts from liability to competitive moat.
The valuation case also looks different at current prices. The stock trades at a trailing P/E of roughly 23x and a forward P/E of 20x, a meaningful discount to where it has traded for most of the past two years. For a company generating $38.46 billion in net income per quarter and returning $12.7 billion to shareholders in dividends and buybacks, analysts view those multiples as undemanding relative to the underlying growth profile.
A 58% Gap Between Price and Target, With MSFT Lagging the Market Badly
Microsoft trades at $372.29 against a consensus target of $587.31, implying roughly 58% upside. The 52-week range runs from $350.42 to $552.24, placing the stock near its annual low even as the business posts record revenue.
Microsoft is down 22.84% year-to-date while the S&P 500 (as measured by SPY) is down roughly 3.3% over the same period. This represents nearly 20 percentage points of underperformance. The 30-day decline of 6.82% significantly outpaced SPY’s 1.98% decline over the same window, confirming MSFT-specific selling pressure is driving the gap.
With 55 of 58 analysts rating the stock Buy or Strong Buy and no active downgrades visible, the conviction behind those targets is real, though consensus targets can lag during periods of rapid multiple compression.
The Bull Case Hinges on Azure Stabilizing
The bull case requires Azure’s growth rate to stabilize at or above 37% over the next two quarters and the contracted RPO backlog to convert into accelerating revenue recognition. In that scenario, the CapEx narrative shifts to infrastructure advantage, the multiple re-rates toward the 28x to 30x range the stock commanded a year ago, and the path toward analyst consensus becomes visible. Four consecutive quarters of earnings beats, a 39% profit margin, and $35.76 billion in quarterly operating cash flow reflect a structurally sound business.
The bear case materializes if Azure’s growth continues decelerating into the 34% to 35% range while CapEx stays elevated near $30 billion per quarter. That combination would force a rethink of the AI investment return thesis, and a 20x forward multiple could compress further. The insider selling activity, with 31 recent transactions trending net negative, is a contrarian signal worth weighing against analyst consensus.
The margin for error is thin. Azure guidance over the next two quarters will be the key variable determining whether the gap between current price and analyst consensus narrows or widens.