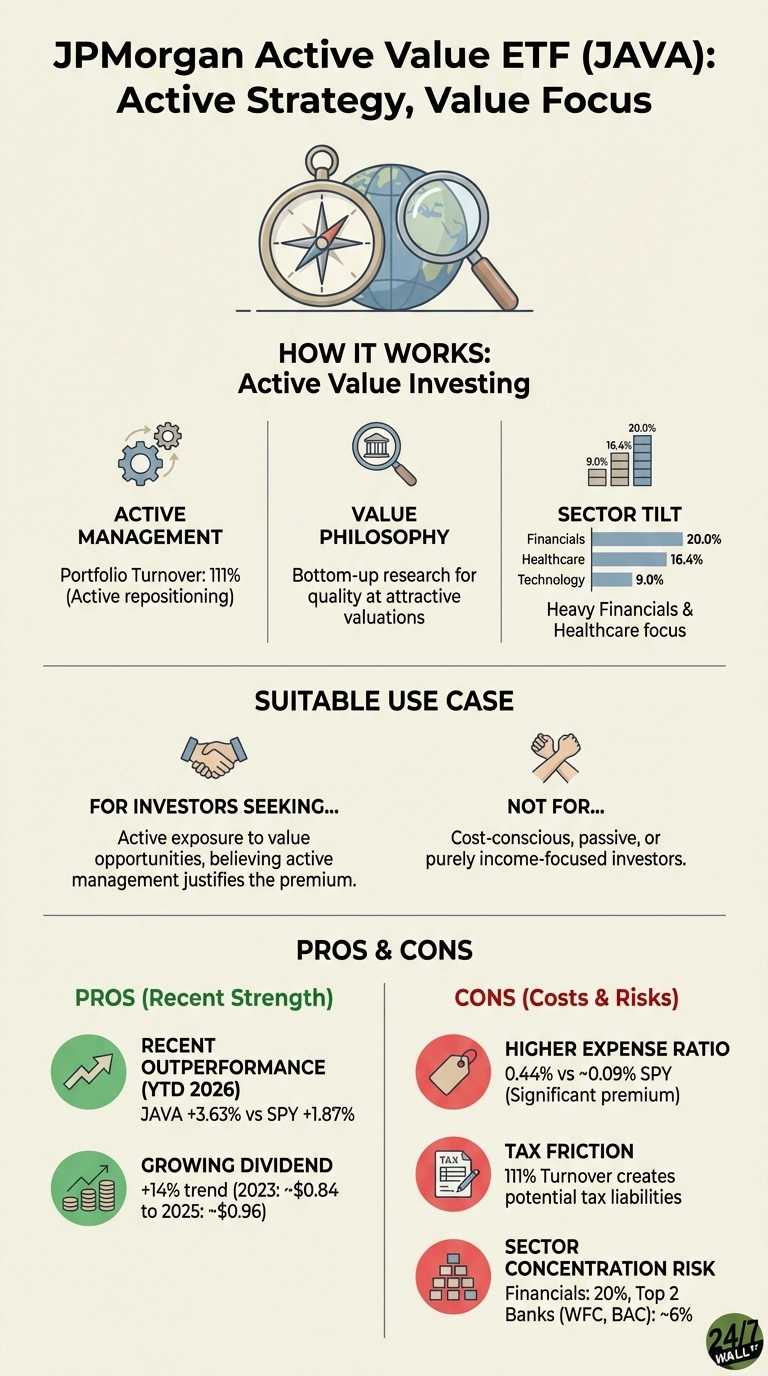
Value investing rewards patience, but not all value strategies are equal. Some use passive index replication, while others employ active managers hunting for mispriced opportunities. JPMorgan Active Value ETF (NYSEARCA:JAVA | JAVA Price Prediction) uses fundamental research to identify quality companies trading below intrinsic worth. The question is whether JPMorgan’s active management justifies the premium.
Where JAVA Fits in a Portfolio
JAVA serves investors seeking value exposure with an active twist. Rather than tracking a value index, the fund’s managers employ bottom-up research to find companies with strong fundamentals at attractive valuations. The portfolio tilts heavily toward financials at 20% and healthcare at 16.4%, with lower technology exposure at 9%.
Wells Fargo (NYSE:WFC) exemplifies JPMorgan’s value hunting philosophy. The bank has transformed its operations post-scandal, driving earnings growth of 17% annually. Yet the market still prices shares at just 14 times forward profits, creating the exact mismatch between quality and valuation that JAVA targets. Bank of America (NYSE:BAC) represents a similar opportunity where operational improvements haven’t yet translated into multiple expansion.
With $5.2 billion in assets under management, JAVA pursues an active repositioning strategy that sets it apart from passive competitors. Management demonstrates conviction through portfolio turnover of 111%, actively shifting allocations as new opportunities emerge rather than waiting for quarterly rebalancing cycles that constrain passive value funds.
Performance Against the Benchmark
JAVA’s recent performance validates the active approach. The fund has kept pace with the S&P 500 (NYSEARCA:SPY) over the past year, but where it really shines is in 2026’s volatile start—the fund’s value tilt helped it outperform the benchmark by nearly two percentage points as growth stocks stumbled.
The fund pays a 1.35% dividend yield with growing payouts that reflect the underlying portfolio’s quality. Quarterly distributions have climbed steadily since inception, demonstrating management’s ability to identify companies with sustainable cash generation.
The Cost of Active Management
Active management demands a premium that compounds over time. JAVA charges 0.44% annually, which means investors pay eleven times more than passive alternatives like Vanguard Value ETF (NYSEARCA:VTV). On a $10,000 investment, that’s an extra $40 annually—a cost that must be justified through consistent outperformance.
The 111% turnover rate creates tax friction. Frequent trading generates short-term capital gains taxed at ordinary income rates, reducing after-tax returns in taxable accounts.
Sector concentration introduces portfolio-specific risk. Wells Fargo and Bank of America together represent nearly 6% of holdings, creating meaningful exposure to financial sector performance. Prediction markets currently assign only a 2% probability to major bank failures through mid-2026, but this concentration means JAVA’s performance will closely track financial sector health.
Who Should Avoid JAVA
Cost-conscious investors building long-term retirement portfolios should look elsewhere. The expense differential versus passive alternatives erodes returns over time, and frequent trading creates tax headaches in non-qualified accounts.
Income-focused retirees have better options. The 1.35% yield trails many dedicated dividend funds, and quarterly payouts don’t provide monthly income some retirees prefer.