The S&P 500 was down 7% on the year barely two weeks ago. By Friday April 17, it hit a new all-time high of 7,126. That puts stocks up more than 4% on the year and at their first record close since February.
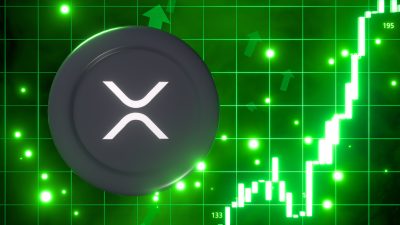
Crypto also bounced back as Bitcoin (CRYPTO: BTC) gained around 4% on the week, XRP broke back above $1.50 for the first time since March, and Ethereum, Solana, and the rest of the market followed. Then Iran closed the Strait of Hormuz over the weekend, and the crypto market gave back 2-3% of those gains.
Bitcoin, XRP, and Ethereum are still down between 15% and 27% on the year, and nobody knows if last week’s rally was the start of a real recovery or just another quick pump that will fade. That uncertainty is why the rotation question makes sense right now: is it time to switch from crypto into the S&P and wait for crypto to fully recover?
The S&P 500 Just Had Its Best Week Since May 2025
The S&P 500 spent most of 2026 underwater. As of April 2, the index was down nearly 7% on the year as the Iran war and the oil shock hit every sector. The ceasefire announcement on April 8 flipped that picture. Over the next two weeks the S&P climbed back to new all-time highs, closing the week ending April 17 up 4.5%—the biggest single week for the index since May 2025.
The Nasdaq gained 6.8% on the week and ran a 13-day winning streak into April 17—its longest since 1992—led by chipmakers like TSMC after it raised 2026 guidance. The Russell 2000 also hit a new record close on Monday April 20 even as the broader market slipped, and when small caps are hitting new highs on a down day, it’s something you don’t get in a narrow, AI-driven rally.
The Iran ceasefire on April 8 and the brief reopening of the Strait of Hormuz on April 17 pulled crude oil down more than 13% on the week, which was enough on its own to take the war premium out of stocks. Then the Q1 earnings report pushed stocks even higher.
Of the S&P 500 companies that have reported so far, 88% have beaten estimates—well ahead of the 10-year average of 76%. With the war premium gone and earnings confirming fundamentals are holding up, the market had enough to send the S&P all the way back to record highs.
Buying Expensive Stocks, Selling Cheap Bitcoin

Strong Q1 earnings and a broad-based rally make a real case for owning the S&P 500 right now. However, you’re paying a premium for them. The S&P’s forward 12-month P/E—how much investors pay for every dollar of next year’s earnings—is at 20.9. That’s above the 10-year average of 18.9 and well above the 25-year average of 16.3. Stocks aren’t in bubble territory, but they’re well above their historical norm.
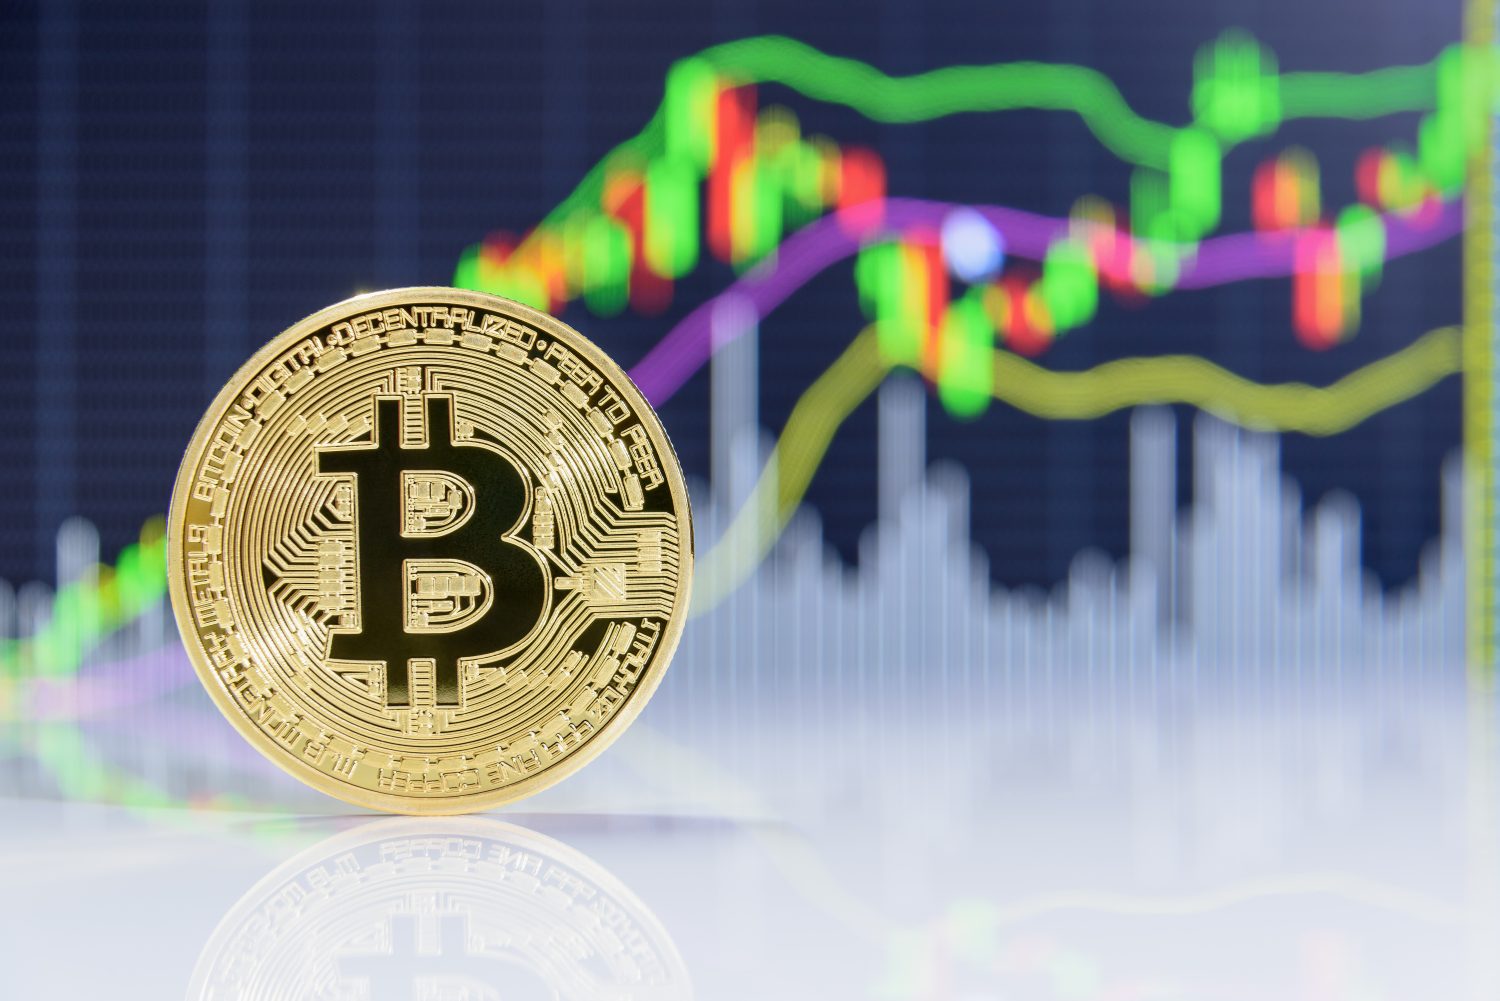
Bitcoin is the inverse, as it’s trading around $75,500, roughly 40% below the $126,000 all-time high from last October. Bitcoin’s on-chain MVRV ratio—which tracks whether holders are in profit or loss—is at 1.39. The average holder is barely in the green, and readings between 1.0 and 1.5 have historically been the range where long-term buyers step in, not where they sell.
So if you’re rotating now, you’d be selling Bitcoin well below where most holders bought, and buying the S&P at one of its most expensive levels in years. You might still make money in the short term, but the starting point for the trade already stacks the odds against you.
Bitcoin Has Never Had Two Losing Years in a Row
Selling Bitcoin after a deep drawdown could be one of the worst calls to make when investing in crypto. Since 2014, Bitcoin has closed four years in the red. BTC was down 57% in 2014, 73.5% in 2018, 64% in 22, and 2025 saw a steep 6.3% drop.
2025 is the odd one out on that list because Bitcoin actually hit a new all-time high of $126,000 in October, but BTC erased the gains after the crypto liquidation that happened. Each of the other three years looked the way this one does right now, and not one was followed by another losing year.
Every one of those down years was followed by an explosive recovery. 2015 closed up 34.5%, 2019 was up 92%, and 2023 saw a 155% surge. Anyone who gave up on Bitcoin in late 2018 or late 2022 missed triple-digit returns in the 12 months that followed. Bitcoin is currently down around 15% on the year, and rotating now locks in that loss right before the year history shows that recovery could follow.
Bitcoin Has Outpaced the S&P 7x Over the Past Decade
The S&P 500 has delivered around 12% annualized over the past decade, while Bitcoin has returned 84% annualized over the same period. Bitcoin has also never had two consecutive losing years in its history, and every down year since 2014 has been followed by a recovery year of at least 34%.
Our take is that the timing doesn’t favour the rotation. It requires selling Bitcoin near a cyclical low to buy the S&P at a decade-high valuation.