Half of Americans Are Falling Short of the 15% Retirement Savings Target

Photo of David Beren
By David Beren Published

Quick Read

  • The 2025 ‘How America Saves’ report finds the average total retirement savings rate is 12.0%, sitting at the floor of the recommended 12%-15% ‘Gold Standard,’ leaving roughly 50% of savers below target and creating widespread retirement underfunding risk.

  • High earners earning over $100,000 need to save 15% annually because Social Security replaces a smaller share of their pre-retirement income, yet only 49% of those earning $150,000+ contribute the statutory maximum of $23,000, leaving tax-advantaged savings space unused.

This post may contain links from our sponsors and affiliates, and Flywheel Publishing may receive compensation for actions taken through them.
Half of Americans Are Falling Short of the 15% Retirement Savings Target

© Lane V. Erickson / Shutterstock.com

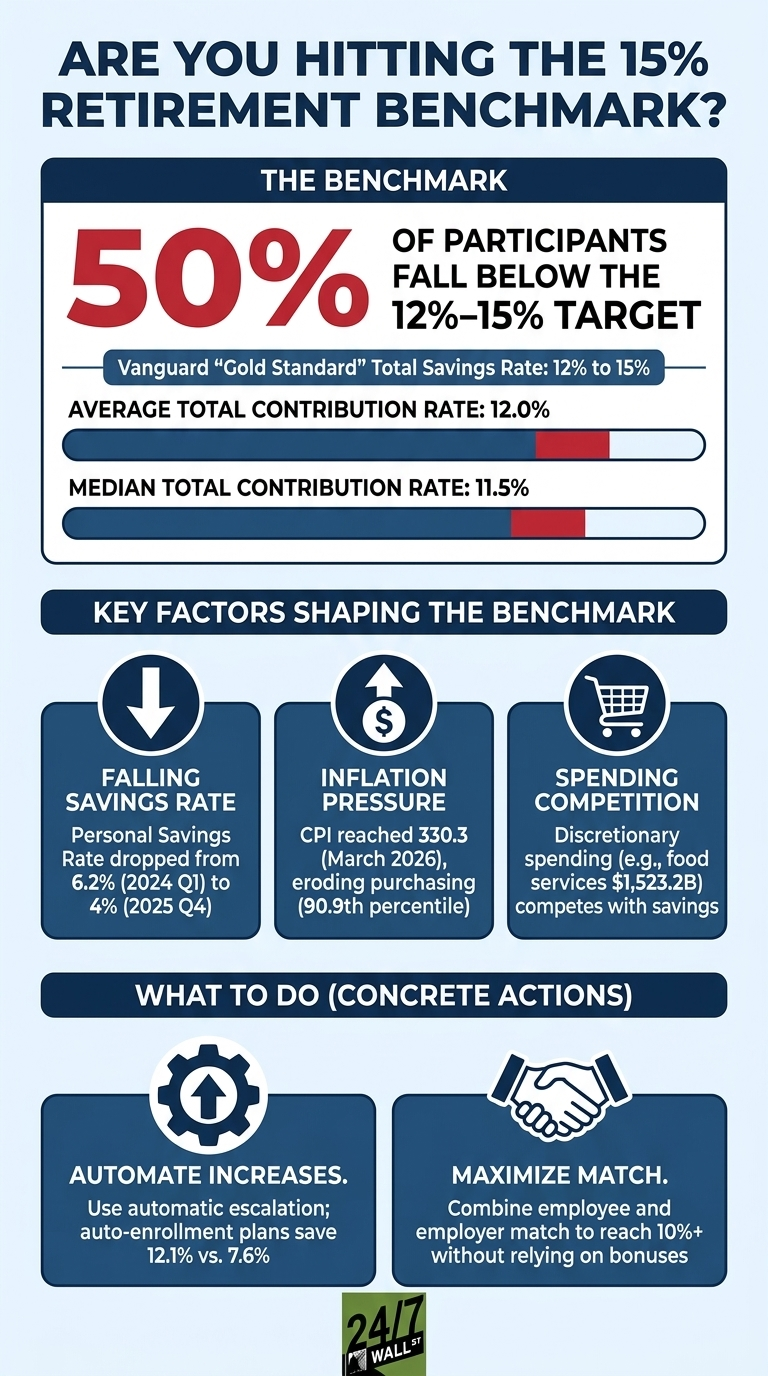
The retirement math for high earners has narrowed to a single question: whether high earners are putting away at least 15% of their income each year, including any employer match. Vanguard’s 2025 How America Saves report puts the “Gold Standard” total savings rate at 12% to 15%, with the higher end specifically aimed at workers earning more than $100,000. The average participant sits almost exactly at the floor of that range, leaving roughly half of savers below it.

The 12% Average Hides a 50% Shortfall

According to Vanguard’s 2025 report, the average total contribution rate, combining employee and employer dollars, is 12.0%, with a median of 11.5%. Because the average sits right at the bottom of the recommended zone, 50% of participants met or exceeded the 12% to 15% target, and the other half landed below it.

An infographic titled 'Are You Hitting the 15% Retirement Benchmark?' The top section, 'The Benchmark,' states that 50% of participants fall below the 12%-15% target savings rate, citing Vanguard's 'Gold Standard.' It shows the average total contribution rate is 12.0% and the median is 11.5%, represented by progress bars. The middle section, 'Key Factors Shaping the Benchmark,' describes three issues: Falling Savings Rate, with a downward arrow icon, detailing a drop from 6.2% (2024 Q1) to 4% (2025 Q4); Inflation Pressure, with an upward arrow and dollar sign icon, noting CPI reached 330.3 in March 2026; and Spending Competition, with a shopping cart icon, mentioning discretionary spending of $1,523.2 billion. The bottom section, 'What To Do (Concrete Actions),' suggests 'Automate Increases' with a gear and upward arrow icon, stating auto-enrollment plans save 12.1% vs. 7.6%, and 'Maximize Match' with a handshake icon, advising to combine employee and employer match to reach 10%+.
24/7 Wall St.
This infographic reveals that half of the participants fall short of the 12%-15% ‘Gold Standard’ retirement savings rate, with average and median contribution rates below the target. It highlights key factors contributing to this gap and outlines actionable steps to improve savings.
The distinction between average and median matters here. The average total contribution rate of 12.0% sits at the bottom of Vanguard’s recommended range, while the median of 11.5% sits just below it. Because these two numbers are clustered near the low end of the safe zone, the typical saver, not just the laggards, is at risk of underfunding retirement.

Why 15% Is the Benchmark for Higher Incomes

Vanguard’s income-tiered guidance recommends 9% for earners under $50,000, 12% for those earning $50,000 to $100,000, and 15% for those earning over $100,000. The reason is the replacement rate. Social Security covers a smaller share of pre-retirement income for high earners, so personal savings have to do more of the work.
 
The plan data shows the strain. Hardship withdrawals hit 4.8% of participants in 2024, up from 3.6% in 2023, with 35% of those going to avoid foreclosure or eviction. Meanwhile, 13% of participants carried an outstanding loan, averaging about $11,000. When workers are tapping retirement accounts for emergencies, long-term contribution rates become harder to sustain.

Where the Money Is Going Instead

Vanguard’s deferral data shows where contributions stall. While the average participant deferral rate reached an all-time high of 7.7% in 2024, 22% of participants still deferred less than 4% of their pay. Only 25% deferred more than 10%. Among those earning $150,000 or more, just 49% contributed the maximum statutory amount of $23,000, meaning even high earners often leave tax-advantaged space on the table.
 
The 12.0% average total contribution includes employer contributions. When nonparticipants are counted, the average aggregate rate drops to 10.1%. In voluntary enrollment plans, that figure falls to 7.6%. The gap between what workers need and what they actually save is not a marginal problem. It is the central one.

Mechanics That Move Savers From 12% to 15%

Three mechanisms commonly close the distance between a 12% rate and the 15% target.

  1. Automatic escalation. Vanguard found that employees in automatic enrollment plans saved 12.1% on average, compared with 7.6% in voluntary plans. Furthermore, 69% of automatic enrollment plans include annual increases in deferrals. In 2024, 45% of all participants raised their deferral rate. A 1% annual auto-increase helps participants reach higher targets without needing to make an active decision each year.
  2. Full employer match. While many aim for a 15% total, the employer does much of the heavy lifting. The average employer contribution value across Vanguard plans is 4.3%. For a participant to reach the 15% gold standard, a common path involves a 10.7% employee deferral paired with that average 4.3% employer contribution.
  3. Tax-advantaged accounts and Roth conversions. With 86% of plans now offering a Roth feature, 18% of participants are using it to build tax-free wealth. For those who have already maxed out standard limits and need more room to reach a 15% total on a high income, 24% of plans offer after-tax 401(k) contributions. About 36% of plans also allow in-plan Roth conversions, which is a tool for participants looking to maximize their tax-advantaged space.
Photo of David Beren
About the Author David Beren →

David Beren has been a Flywheel Publishing contributor since 2022. Writing for 24/7 Wall St. since 2023, David loves to write about topics of all shapes and sizes. As a technology expert, David focuses heavily on consumer electronics brands, automobiles, and general technology. He has previously written for LifeWire, formerly About.com. As a part-time freelance writer, David’s “day job” has been working on and leading social media for multiple Fortune 100 brands. David loves the flexibility of this field and its ability to reach customers exactly where they like to spend their time. Additionally, David previously published his own blog, TmoNews.com, which reached 3 million readers in its first year. In addition to freelance and social media work, David loves to spend time with his family and children and relive the glory days of video game consoles by playing any retro game console he can get his hands on.

Featured Reads

Our top personal finance-related articles today. Your wallet will thank you later.

Continue Reading

Top Gaining Stocks

CBOE Vol: 1,568,143
PSKY Vol: 12,285,993
STX Vol: 7,378,346
ORCL Vol: 26,317,675
DDOG Vol: 6,247,779

Top Losing Stocks

LKQ
LKQ Vol: 4,367,433
CLX Vol: 13,260,523
SYK Vol: 4,519,455
MHK Vol: 1,859,865
AMGN Vol: 3,818,618