The $110,000 Illusion: Why Vanguard’s “Average” Retirement Balance is a Lie

Photo of David Beren
By David Beren Updated Published

Quick Read

  • Vanguard’s 2025 How America Saves report shows the median 401(k) balance was $38,176 in 2024, not the headline $148,153 average, because high earners with $250,000+ accounts (16% of participants) skew the data upward while 28% of participants hold less than $10,000.

  • The gap stems from income disparity and tenure: workers earning $150,000+ have 95% plan participation versus 31% for those under $15,000, and participants with 10+ years average $324,510 versus $6,140 for those with under two years.

This post may contain links from our sponsors and affiliates, and Flywheel Publishing may receive compensation for actions taken through them.
The $110,000 Illusion: Why Vanguard’s “Average” Retirement Balance is a Lie

© fizkes / Shutterstock.com

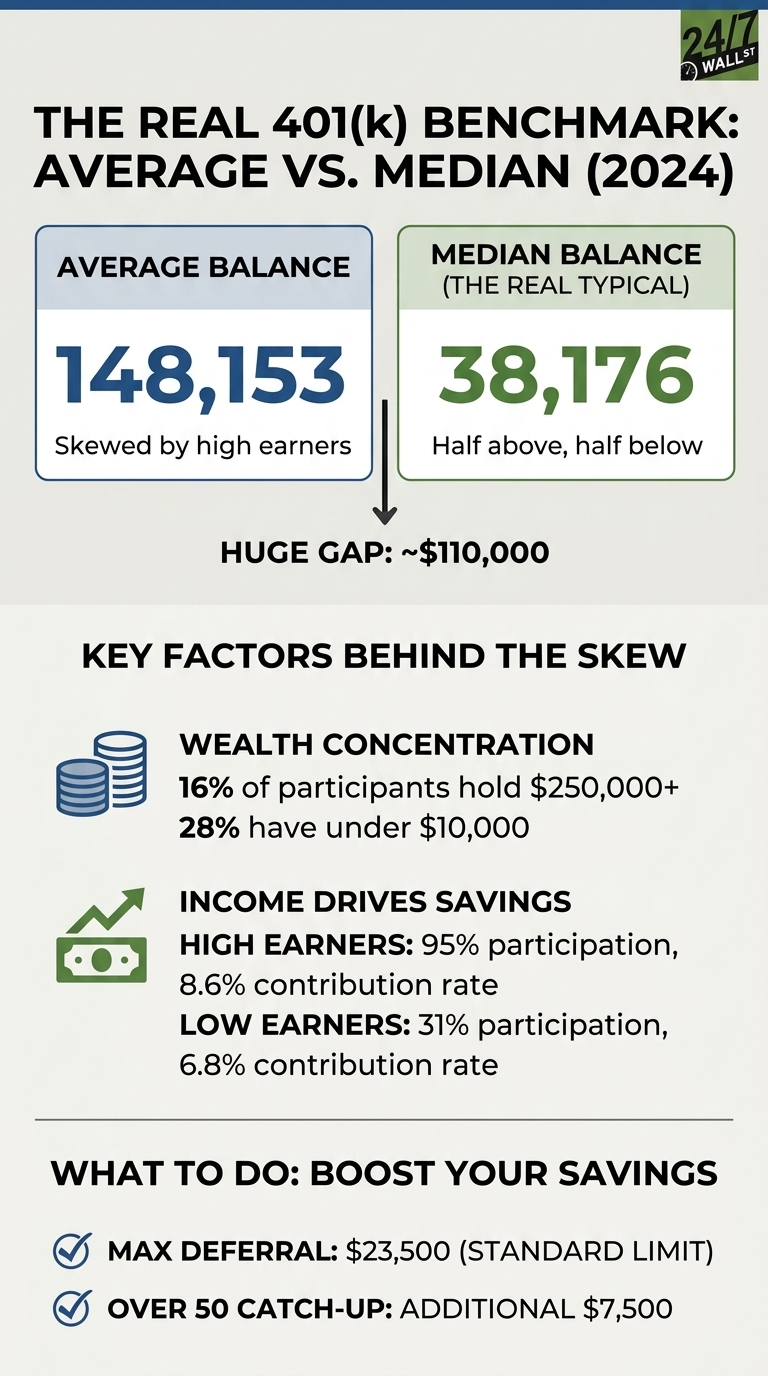
The headline number from Vanguard’s 2025 How America Saves report looks reassuring at first glance: the average 401(k) account balance reached $148,153 in 2024. That figure suggests the typical American worker is sitting on a six-figure retirement nest egg. The median tells a different story. The median balance, the one that actually describes the worker in the middle of the distribution, was $38,176. The roughly $110,000 gap between those two numbers reflects the distribution of balances.

An infographic titled 'THE REAL 401(k) BENCHMARK: AVERAGE VS. MEDIAN (2024)'. It prominently features two boxes: one for 'AVERAGE BALANCE' showing '$148,153' with the note 'Skewed by high earners', and another for 'MEDIAN BALANCE (THE REAL TYPICAL)' showing '$38,176' with 'Half above, half below'. An arrow points from the balances down to the text 'HUGE GAP: ~$110,000'. Below this, a section titled 'KEY FACTORS BEHIND THE SKEW' outlines 'WEALTH CONCENTRATION' (16% of participants hold $250,000+, 28% have under $10,000) and 'INCOME DRIVES SAVINGS' with data for 'HIGH EARNERS' (95% participation, 8.6% contribution rate) and 'LOW EARNERS' (31% participation, 6.8% contribution rate). The final section, 'WHAT TO DO: BOOST YOUR SAVINGS', lists 'MAX DEFERRAL: $23,500 (STANDARD LIMIT)' and 'OVER 50 CATCH-UP: ADDITIONAL $7,500', each with a checkmark icon.
24/7 Wall St.
This infographic illustrates the significant difference between the average and median 401(k) balances in 2024, revealing how high earners skew the overall average.

Why the Average Distorts

A simple illustration explains the distortion. If 10 people each have $5,000 saved and one person walks in with $5 million, the median balance is still $5,000. The average jumps to roughly $459,000. Nothing changed for the typical saver, but the headline number now suggests everyone is wealthy.

The same dynamic plays out in 401(k) data. Vanguard explicitly notes that the median “represents the typical participant: Half of all participants had balances above the median, and half had balances below.” The average, by contrast, “is indicative of participants at about the 75th percentile”, meaning roughly 75% of workers have balances below it.

Where the Skew Comes From

The pull at the top is concentrated and, according to Vanguard, only 16% of participants hold $250,000 or more in their accounts. It’s those balances that do the heavy lifting on average. At the same time, only 28% of participants have less than $10,000. The distribution is a steeply sloped, heavy-tailed curve rather than a tidy bell curve clustered around $148,153.

Income explains much of that tail as participants earning $150,000 or more had a 95% participation rate in their employer plans, compared with 31% for those earning under $15,000. High earners also defer more of their pay, contributing an average of 8.6% of income versus 6.8% for the lowest earners. Higher salaries and longer tenures, along with a relatively small share of accounts, drive the headline figure.

The Macro Backdrop Makes the Gap Worse

The report shows that the savings environment isn’t just about income; it’s about how long people stay in the game and how often they tap their funds. While the average account balance is high, tenure is a massive divider. Participants with more than 10 years in their plan have an average balance of $324,510, while those with less than two years have a median of just $6,140.

The pressure isn’t just coming from inflation, but from plan leakages. In 2024, 12% of participants had an outstanding plan loan. Furthermore, while the market was strong, hardship withdrawals rose to 4.8%, with 35% of those participants citing the need to prevent foreclosure or eviction. This suggests that for many “middle-of-the-pack” savers, the 401(k) is increasingly doubling as an emergency fund.

Reading the Real Number

For a savvy reader, the median of $38,176 is the most honest benchmark for the “typical” American worker. The report makes it clear that the $148,153 average is a “75th percentile” number, meaning if you have that much, you are already doing better than three-quarters of all other savers.

The real drivers of the balance gap are simple but hard to beat: time and consistency. The report shows that the small group of savers driving the average higher is made up of those who have stayed with the same employer for over a decade and have reached the “Gold Standard” total contribution rate of 15%.

Reference Points

  • Vanguard and the Federal Reserve Survey of Consumer Finances publish age-bracket median 401(k) balances, which sit closer to the typical participant than headline averages.
  • The 8.6% contribution rate at the top income tier compared with 6.8% at the bottom is one driver of the long-run balance gap.
  • The standard 401(k) deferral limit is $23,500, with an additional $7,500 catch-up available for workers over 50.
Photo of David Beren
About the Author David Beren →

David Beren has been a Flywheel Publishing contributor since 2022. Writing for 24/7 Wall St. since 2023, David loves to write about topics of all shapes and sizes. As a technology expert, David focuses heavily on consumer electronics brands, automobiles, and general technology. He has previously written for LifeWire, formerly About.com. As a part-time freelance writer, David’s “day job” has been working on and leading social media for multiple Fortune 100 brands. David loves the flexibility of this field and its ability to reach customers exactly where they like to spend their time. Additionally, David previously published his own blog, TmoNews.com, which reached 3 million readers in its first year. In addition to freelance and social media work, David loves to spend time with his family and children and relive the glory days of video game consoles by playing any retro game console he can get his hands on.

Featured Reads

Our top personal finance-related articles today. Your wallet will thank you later.

Continue Reading

Top Gaining Stocks

CBOE Vol: 1,568,143
PSKY Vol: 12,285,993
STX Vol: 7,378,346
ORCL Vol: 26,317,675
DDOG Vol: 6,247,779

Top Losing Stocks

LKQ
LKQ Vol: 4,367,433
CLX Vol: 13,260,523
SYK Vol: 4,519,455
MHK Vol: 1,859,865
AMGN Vol: 3,818,618