Vanguard’s 2025 How America Saves report describes a 401(k) landscape that appears healthy on the surface yet strained beneath. The average participant account balance climbed to a record level in 2024, but the share of workers tapping those same accounts under financial duress also hit a record. The two trends ran in parallel, and the gap between them is the story of how the average American household experienced the past year.
Record Balances, Record Withdrawals
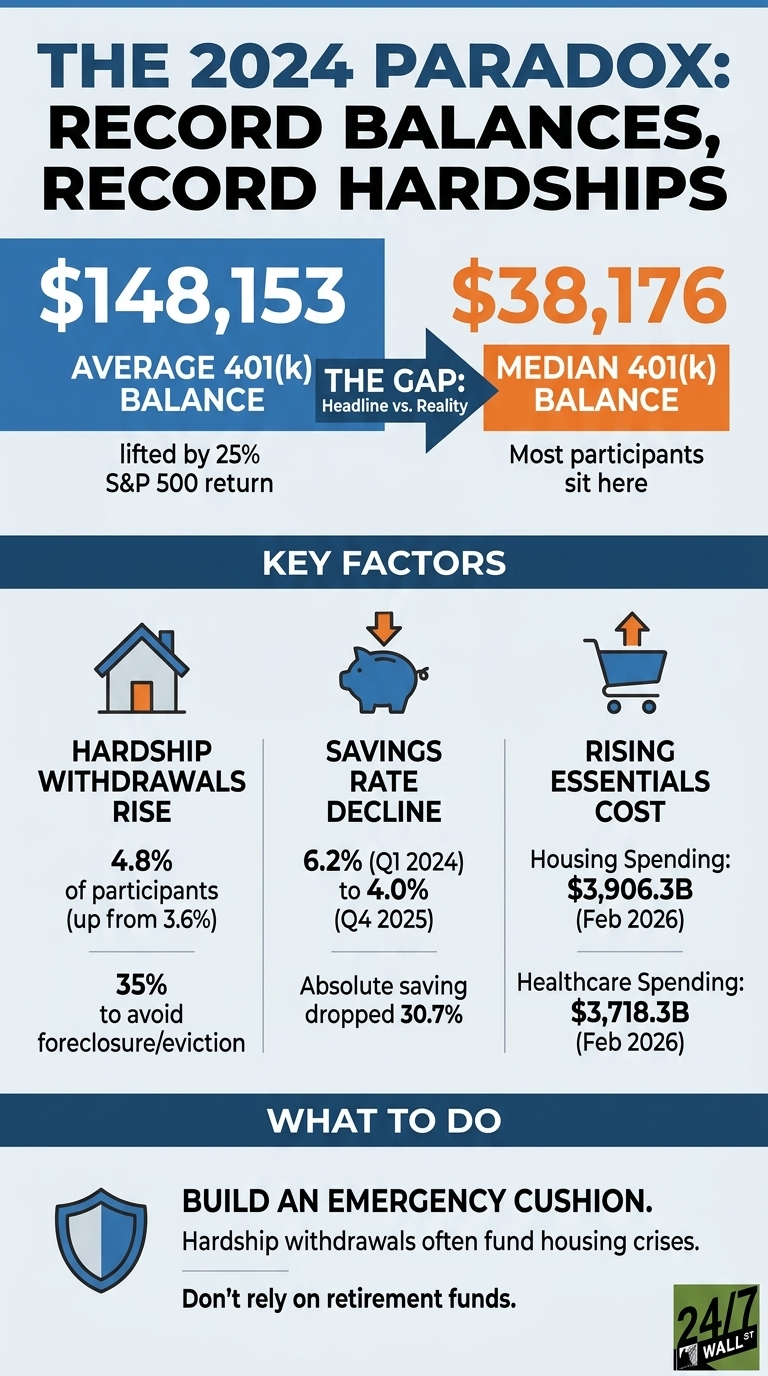
According to Vanguard, the average account balance rose 10% in 2024 to $148,153, lifted by stock prices that gained 23% during the year. The median balance, which strips out the pull of very large accounts, was $38,176. The distinction matters. Vanguard notes that the average “is indicative of participants at about the 75th percentile,” meaning roughly three in four workers have balances below it, while the median “represents the typical participant.” In other words, a smaller group of large accounts is doing most of the lifting on the headline number.
At the same time, hardship withdrawal usage rose to 4.8% of participants in 2024, up from 3.6% in 2023. Of those withdrawals, 35% were used specifically to avoid home foreclosure or eviction. Workers were using retirement accounts as last-resort emergency funds rather than to finance discretionary purchases.
The K-Shaped Split
The Vanguard data breaks the participant base into income tiers, and the divide is wide. 95% of employees earning more than $150,000 participate in their workplace plan, compared with 31% of those earning under $15,000. Among participants, those with balances under $10,000 make up 28% of accounts and borrowed an average of 36% of their balance, the highest share of any balance group. Auto-enrollment plans posted 94% participation, versus 64% for voluntary plans, but auto-enrollment can put a low-income worker into a plan without resolving the cash-flow problem that later forces them to withdraw.
What the Macro Data Shows
The broader picture inside Vanguard plans lines up with the hardship trend rather than the balance trend. The average participant deferral rate was 7.7% in 2024, an all-time high, but 22% of participants still deferred less than 4% of their pay. Meanwhile, 45% of participants saw their deferral rate increase during the year, either through automatic escalation or their own direction, while 8% decreased it, and 2% stopped contributing entirely.
Essentials absorbed most of the strain. Of the 4.8% of participants who took hardship withdrawals in 2024, 35% were taken to avoid home foreclosure or eviction, and 30% were used for medical expenses. These were not discretionary purchases; they were last-resort liquidity events. At the same time, 13% of participants had an outstanding loan, with the average loan amount running about $11,000. Workers were using retirement accounts as emergency funds because other buffers had thinned.
Practical Implications
A few observations line up with the data:
- Median versus average. A $38,176 benchmark is closer to where most participants actually sit than the $148,153 headline figure.
- Emergency fund layering. The 35% of hardship withdrawals tied to foreclosure or eviction reflects households that did not have a non-retirement cushion when housing or medical costs rose.
- Automatic enrollment and auto-escalation. Vanguard’s 94% participation rate in auto-enrolled plans is meaningful only when the default contribution rate continues to rise over time. In 2024, 61% of plans automatically enrolled at 4% or higher, up from 39% in 2014, and 69% of auto-enrollment plans paired that with automatic annual increases.
The 2024 paradox is that the same year produced both record account values and record emergency drawdowns from those accounts. The averages went up. The room to absorb a shock did not.